Viewing ongoing operations (thread activity) in memory snapshot.
System-wide CPU usage
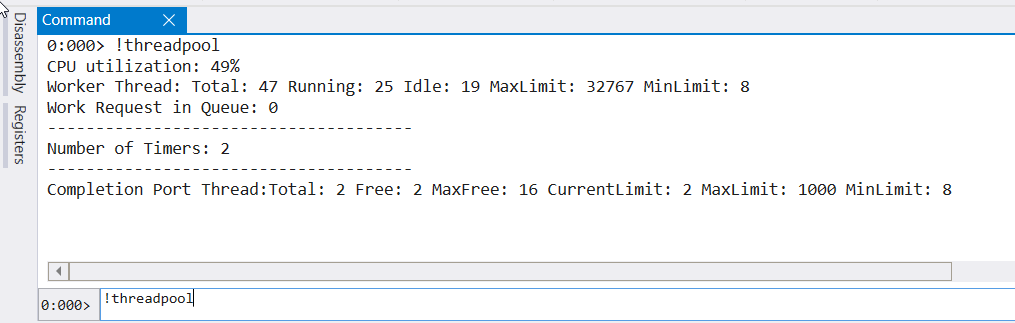
!threadpool gives average CPU usage during last second + thread pool stats:
Use case
- Is CPU maxed?
- How many concurrent operations are being processed?
- Is there any work queued due to lack of CPU/worker threads?
Flags
- Over 100 threads & low CPU likely flags a bottleneck in dependent resource (f.e. SQL, Redis, WebAPI calls)
- 81 % CPU flags garbage collection is running
- Huge
Work queueflags operations are added faster than being processed
Notes
- Command is overloaded by MEX, thereby unload extension prior to the call
- CPU is system wide meaning other processes could steal the show
Ongoing operations performed by managed threads
!eestack -ee by SOSEX prints each managed thread call stack:

Use case: Figure out what activities are performed in the snapshot.
Notes
FileWatcher/LayoutWatcher (threads dedicated to certain activity) wake up once in a while (like every half second) to do the status check, they are not usually interesting.
Sitecore.Threading.ManagedThreadPool threads are persisted during application lifetime so that visible in output. Should no operations be added for processing, threads would be idle-ing, hence not consuming any CPU.
How much CPU did each thread consume?
!runaway shows how much CPU time did each thread consume since app start:

Use case: Comparing the numbers between two sequential snapshots would highlight top CPU-consuming threads in between. Stats from single snapshot rarely makes any use since data is aggregated per-thread since application start.
Non-managed stack traces
~* kb 20 outputs top N frames from every thread in application:

Use case: Figuring out what unmanaged operations are running (GC/finalization, attempts to enter critical sections).
Notes: 81% CPU usage is a magic number that likely indicates garbage collection is running, top frame would show phase (f.e. mark/compact). The MSDN article mentions dedicated threads for GC – you can see them on your own (the ones with gc_heap) in unmanaged call stacks.
List threads with exceptions and monitors owned
!threads by SOSEX would print all threads in app:

Use cases
- Does the number of threads look expected?
- What threads are inside
lockstatements? - Is there any active exception?
!threads -special would print thread role:

Switching to thread context
~[ThreadNumber]s would set [ThreadNumber] as context one, picture sets last ThreadPool worker thread as context one.

Use cases: inspect objects that live on thread stack, map them to executed frames.
Dump stack objects
!mdso by SOSEX prints objects that live in thread stack:

Use case: Get the data thread operates with (method args would live here).
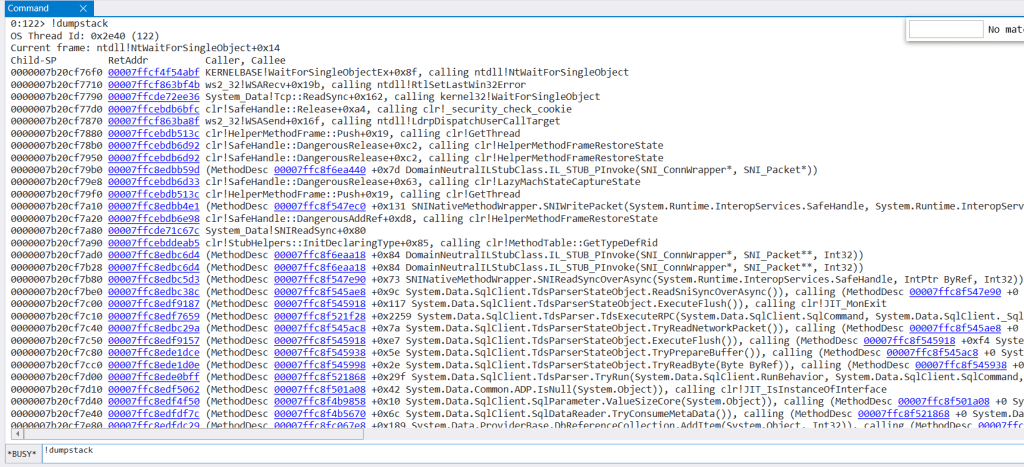
Restoring thread call stack
Call stacks could make no sense from first sight as CLR can optimize code execution. !dumpstack & clrstack use different semantics to restore call stacks: