
Find out the slowness cause from a single snapshot
Likewise looking at an image on top, can you identify why the car is ahead? No, unless something very obvious (burning engine). You rely on performance profiles for the purpose.

Are there any controls/combos to navigate through the snapshot?
Yes, I’ve handpicked the useful commands here.
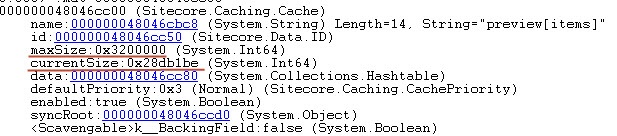
Check cache statistics
Yes, in-memory caches can be located by type and inspected:

Inspect what operations are being performed
Yes, you can see what does each thread do at a time of snapshot generation. If application was hanging, you’ll see why.
