WinDBG debugger brings you behind the scenes to witness CLR magic from backstage. You’ll be able to see the hidden gems that turn magic into reality.
This post shows basic WinDBG commands to begin your journey. It is a good one to start exploring the world full of fascinating technical magic.
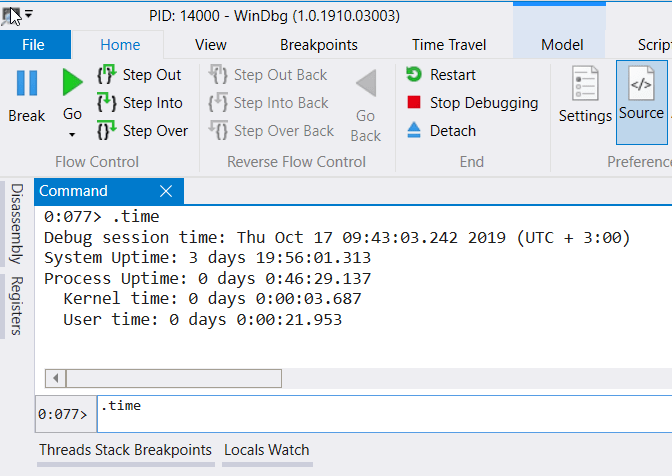
Snapshot creation time
Similar to picture capturing a single point in time, memory snapshots captures the process state in single moment.
.time command shows when the snapshot was taken or time of the debugging session (in case attaching to process)
Use case: Get the time diff between a few sequential memory snapshots.
The distance between SPECS cameras is known as well as speed limit. Hence the minimal legal journey time is known.Speeding fine shall be issued in case two cameras capture same car in shorter span.
Load extension
.load [path] command loads WinDBG extension into debugger

Anybody can create extension to automatize the sequence of re-occurring steps.
Use case: Extensions provide additional commands to execute, or better view for same data (like displaying object content !do vs !mdt).
List of loaded extensions into WinDBG
.chain command shows extensions currently loaded into debugger

Use case: Verify extensions powering commands are loaded (f.e. mex).

List threads
!thread lists threads in the process:

Use case: Answer these questions:
- Are there any exceptions being handled?
- Are there any locks owned?
- How many application domains are there?
- Is the number of threads seem legit?
Hint: !threads -special would show threads with specific roles (GC, Finalizer, IOCompletion)
Switch to the thread
~[thread_number]s switches debugger to the thread:

Use case: Investigate thread-specific data (like call stack or thread stack values).
Get unmanaged call stack
kb [number of frames] gets unmanaged thread call stack

Use case: Check the garbage collection phase.
