Memory snapshot captures a picture of the process in time. It is a source of wonderful information about application. You can see on your own what operations are being executed, is there a bottleneck around locking expensive resource and so much more. The most important part to me is to see the application from the angle you’ve never seen it before.
This post shows how to unlock access to the data.
Pre-requirements
WinDbg is to be installed from Microsoft store:
Alternatively, WinDbg could be installed as a part of Debugging Tools for Windows SDK.
Drag & Drop *.dmp file into WinDBG

Main bits to read snapshot data
The debugger must load data access component (DAC) (mscordacwks.dll) from the machine snapshot was created on.
Although in 99% of the cases debugger is able to load needed version from the web, you might need to copy it from ‘%WINDOWS%\Microsoft.NET\Framework64\[framework_version]\mscordacwks.dll‘ location.
WHAT IS ‘SOS’ ?
SOS Debugging Extension (SOS.dll) provides information about the internal Common Language Runtime (CLR) environment. In simple words – it translates data to human-understandable format
Automatically load needed assemblies
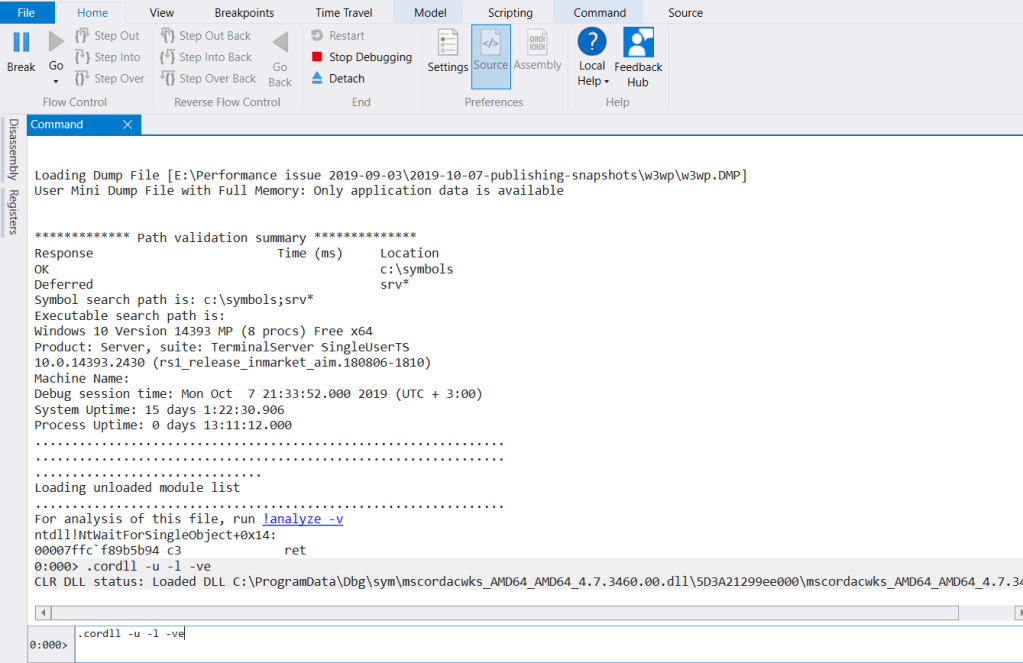
The .cordll -u -l -ve command attempts to automatically load core dll:
Manually load needed assemblies
Should command fail to locate matching version, you’ll need to get the assembly from source machine and manually load it with .load:

Open local memory snapshot
Should the memory snapshot be collected from local machine, local core dll can be loaded via .loadby sos clr command:

Verify snapshot is loaded correctly
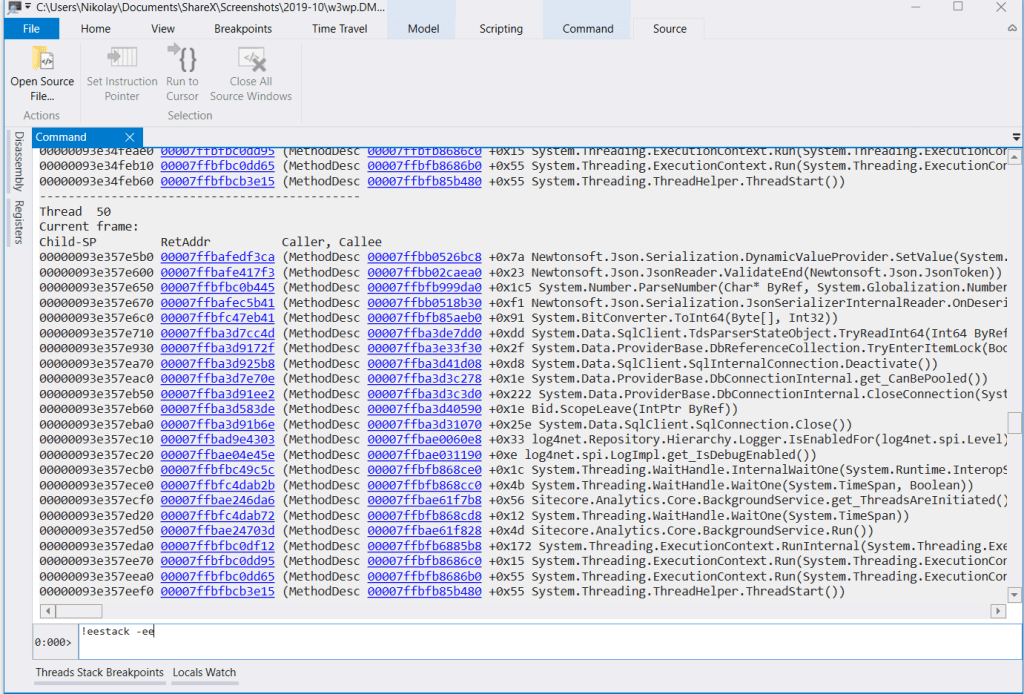
Execute any sos-driven command (f.e. !eestack -ee ) to verify snapshot loaded correctly:

One thought on “Loading memory snapshot into debugger”