How busy CPU is?
!theadpool command shows avg. CPU usage (during last second), number of active threads, and callbacks:

Use case: High CPU investigations, ensure snapshot was collected during maxed CPU. Shows pending callbacks (if any) as well as how many threads are there.
What threads are consuming CPU time?
!runaway shows aggregated CPU time taken by each alive thread:

Use case: A difference between a few sequential snapshots shows threads using CPU resource in between. Useful during high CPU investigations.
What does each thread do?
Each thread either performs some operation, or waits to do something.
!eestack -ee prints managed call stacks for all the threads:
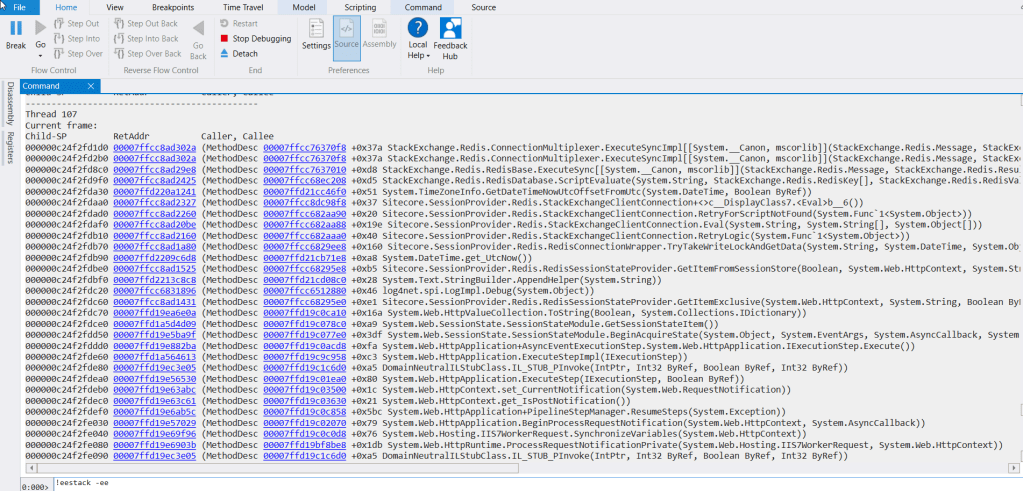
Use case: Get an overview of ongoing activities, always useful:
- Are threads waiting for exclusive access? F.e.
lock (obj) - Are ASP.NET requests being processed? Trail – IIS7WorkerRequest class
- What are the operations performed by most CPU consuming threads?
- Similar/repeatable patterns?
What does each thread do (shorten version)
Mex extension powers !mthreads showing top frame/action performed by thread:

Use case: High-level overview of ongoing operations in the snapshot
Group threads by call stacks
MEX !uniquestacks groups threads by operations they execute:
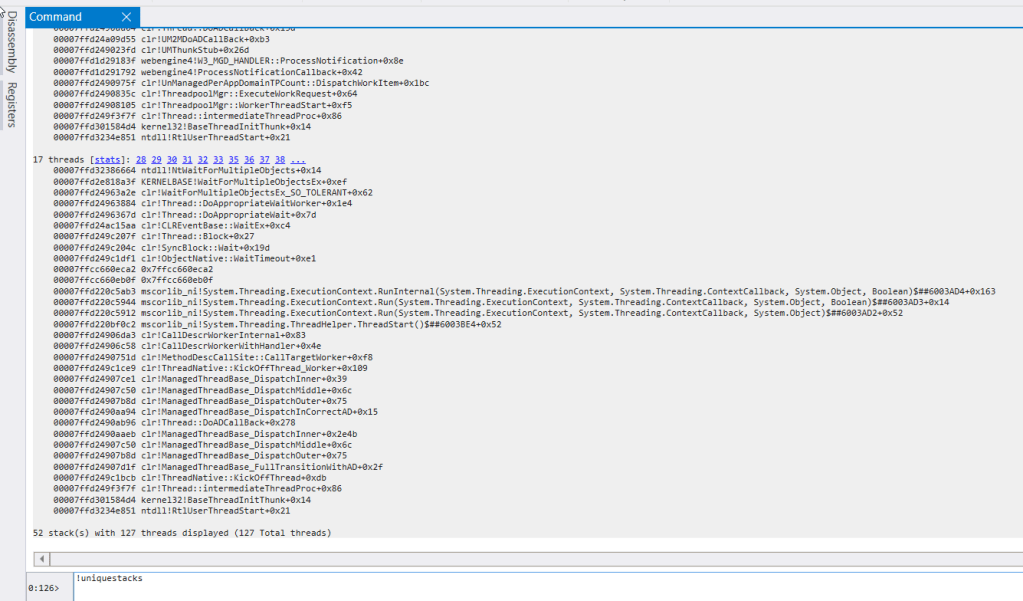
Use case: Locate repeatable patterns in one go.
Find currently executed ASP.NET requests
MEX !aspxpagesext gives stats for processed ASP.NET requests:
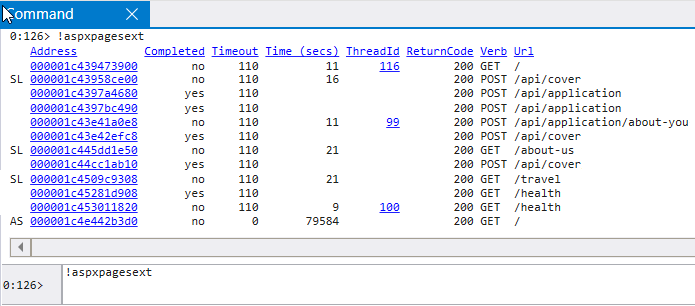
Use case: Get the number of concurrent requests & how long they run for.
