This post shows WinDBG commands to analyse SQL queries produced by application. Answering the mystery what parts of program bombard SQL Server with queries.
Ongoing SQL commands
MEX !sqlcmd finds all SQL commands & their state & executing thread:

Use case: Figuring out the nature of load produced on SQL Server. An owner thread call stack would show where the query is coming from.
SQL connectivity stats
MEX !sqlclientperfcounters displays the connection stats:
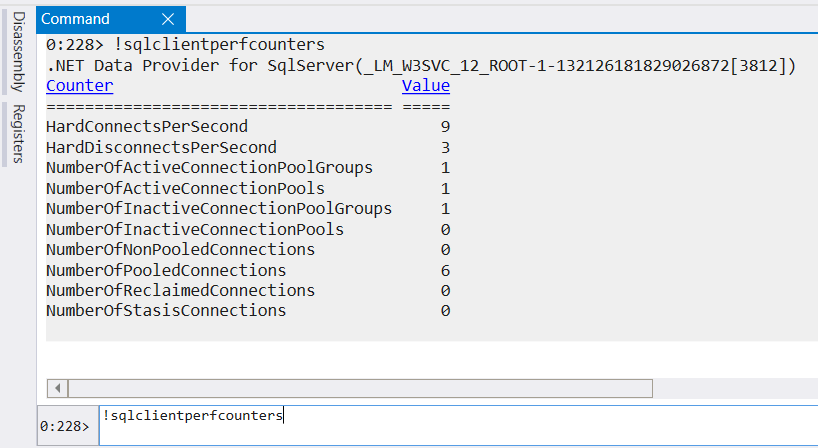
Use case: Number of pooled connections could be treated as max SQL commands executed concurrently. That is useful to understand if snapshot collected during peak pressure.
SQL Commands per database
!sqlcn groups commands per connection string:

Use case: Shows most-queried (connection strings)/databases application-wide.
Find all DataSets
!dumpdataset finds DataSet instances in memory with a possibility to view content:
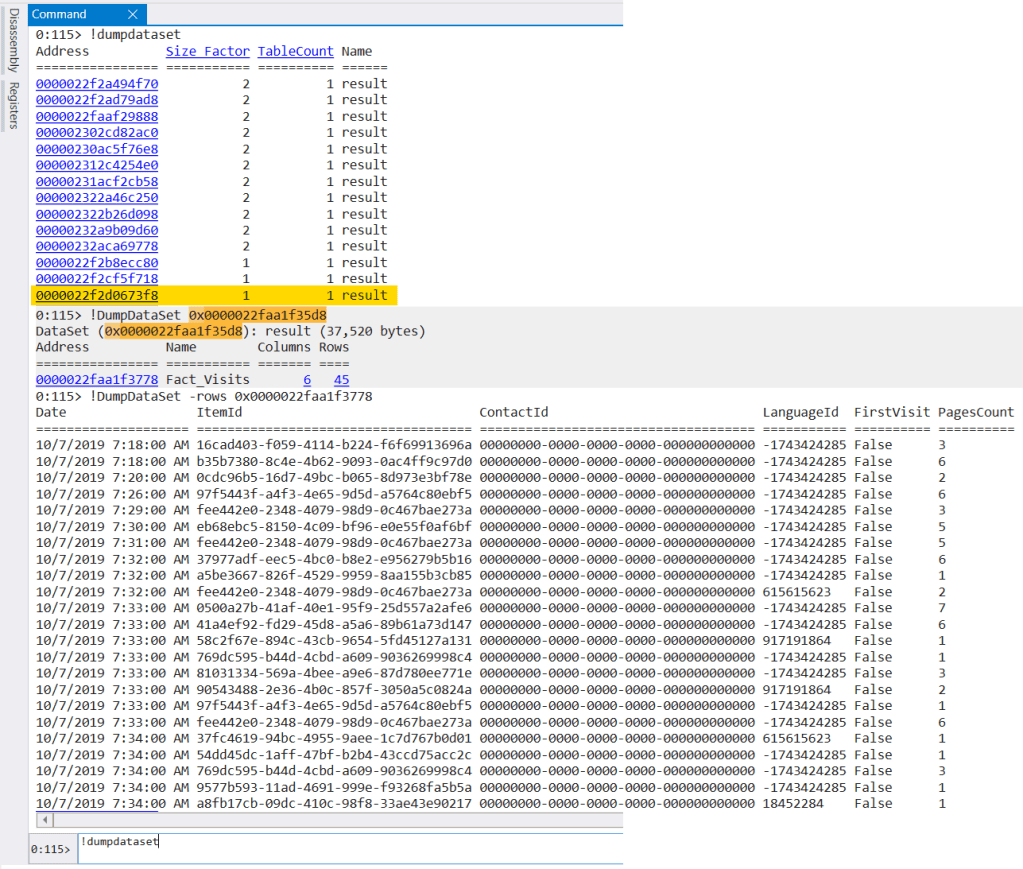
Use case: Find the data that mimics database content (either a caching layer, or collected data pending to be pushed). Sitecore Processing uses DataSets to populate reporting (one interesting investigation is coming).
