Case study: Analytics reports were a few weeks behind.
Sitecore Reporting introduction
- Analytics data is flushed into collection database once visitor session ends
InteractionLiveProcessingPoolgets an entry (visit) to be aggregated- Sitecore Aggregation Server picks records from this pool & aggregates them
- Aggregated data is added into Reporting db that is used to build reports
Narrow issue cause down
- Visitor data is flushed into collection database as number of records increases
- Interaction live processing pool grows – aggregation is not fast enough
How many visits are pending for aggregation?
The processing pool had over 740K records with oldest entry dated a few weeks ago (same as latest report data).
Throw in more hardware?
Unfortunately, that is the solution the majority decides to take despite:
- There are no proves existing hardware is used efficiently
- The current setup is properly configured
- There are no proves additional hardware would help
Investigation plan
- Restore prod dbs locally
- Configure aggregation locally
- Launch SQL Server profiler for ~60 seconds
- Launch PerfView for ~30 seconds
- Collect a few memory snapshots
Collection phase
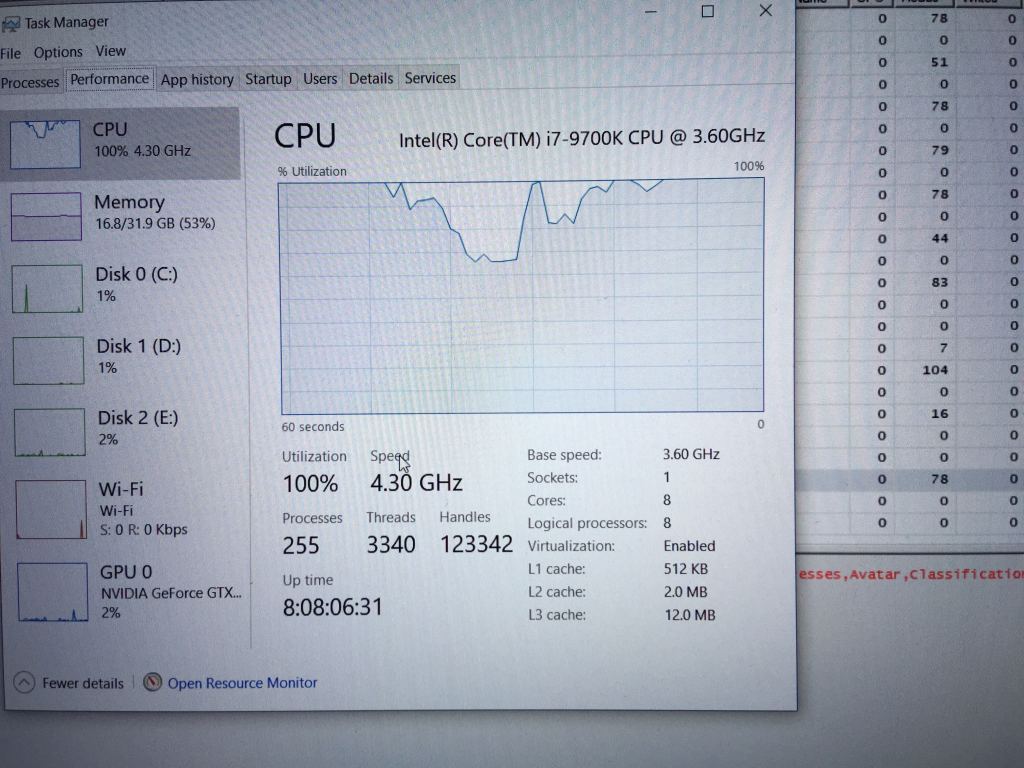
Triggering aggregation locally with prod dbs killed laptop:

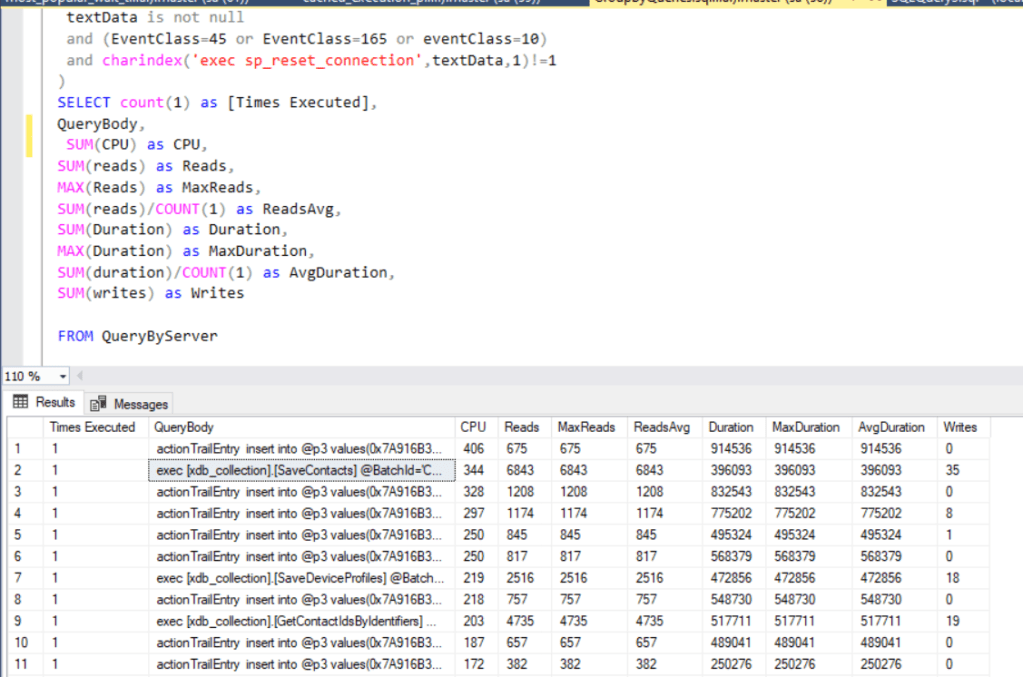
Task manager has shown 80% of CPU usage by SQL Server. Even though queries did not consume much CPU, they had huge duration:

Please tell me where it hurts:

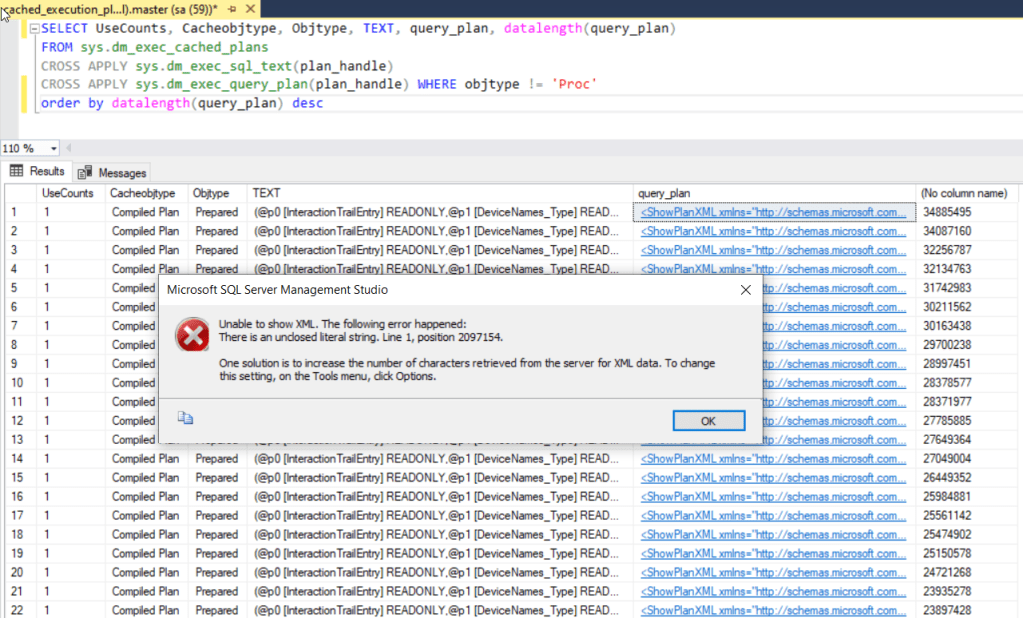
RESOURCE_SEMAPHORE_QUERY_COMPILE is on top of the wait list highlighting query compilations are bottleneck. Good thing we could inspect already compiled plans to get a glimpse of queries:

Ironically, query plan cannot fit default XML output size.
SQL Server needs over 30MB solely for describing how query is to be executed. There are many ‘huge’ queries processed at a time causing compilation gate to hit the limit.
Inspecting memory snapshot
!sqlcmd -s open command gives us a list of all SQL requests:

No wonder MSSQL Server is dying as the first SQL command has 1.7M characters:

The command is run by 58th thread:

It turns out that huge commands are produced by Analytics SQL bulk storage provider. Instead of doing many lightweight SQL calls, it collects them into a batch to avoid network latency cost for each command.
Solution: Stored procedures would reduce the length of SQL query & allow reusing compiled query plans => resolve bottleneck.
Intermediate summary
The behavior was reported to Sitecore:
- Performance issue 370868 has been registered
- AD-hoc queries are converted into Stored procedures for by Support
- Hotfix to increase the aggregation speed has been provided
As a result, aggregation speed increased two times at least.
Even though further improvements are on the deck, I’ll save them for future posts.
One thought on “Why are reports outdated?”