The case study on how the harmless collection could silently cause system to work slower and remain undetected for ages.
Tag Archives: Case study
Performance crime: config to kill performance
Would you as a developer allow a setting that can make system 15 550 times slower? I’ve received a few memory dumps with high CPU; each scavenges AccessResultCache: How big is the cache so that every snapshot contains the operation? Detecting cache size from the snapshot A ClrMD code snippet locates objects in Sitecore.Caching.Generics.Cache namespaceContinue reading “Performance crime: config to kill performance”
Performance crime: no respect for mainstream flow
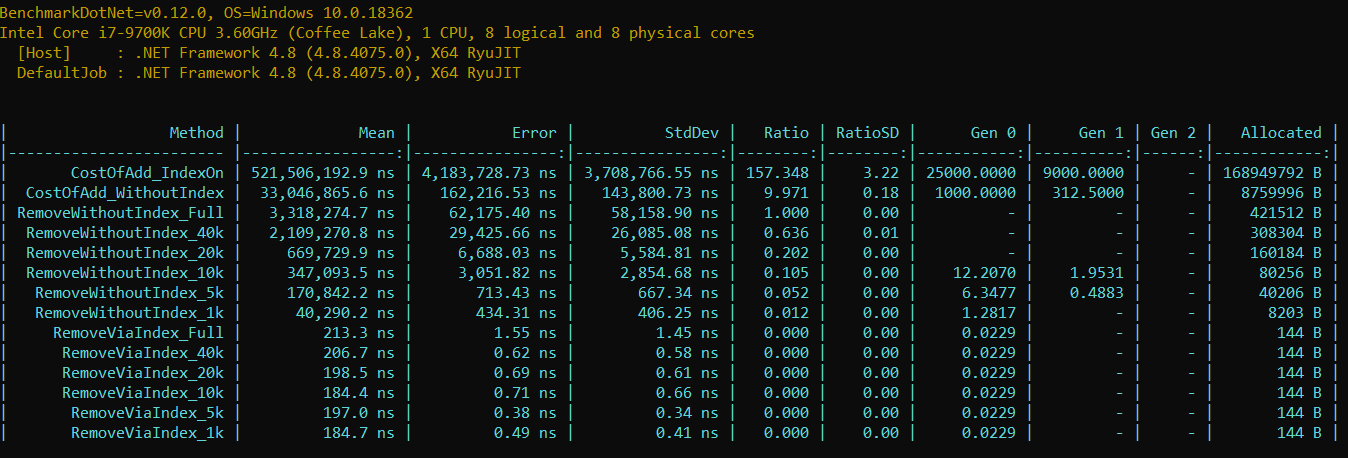
How expensive a lack of respect to mainstream usage could be?
Performance crime: wrong size detection
The amount of memory cache can use is defined in config: That is needed to protect against disk thrashing – running out of physical RAM so that disk is used to power virtual memory (terribly slow). That is a big hazard in Azure WebApps – much less RAM compared to old-school big boxes. Sitecore keepsContinue reading “Performance crime: wrong size detection”
Performance crime: careless allocations
I was investigating Sitecore Aggregation case a time back and my attention was caught by GC Heap Allocation mentioning RequiresValidator in top 10: Combining all generic entries together leads to over 7% of total allocations making it second most expensive type application wide! Yes, all it does is check object is not null Yes, itContinue reading “Performance crime: careless allocations”
Why are reports outdated?
The story how aggregation performance was investigated.
Tackling memory leak
The real world case study on finding memory leak.
