Let’s start with a guess – what is the most CPU-heavy operation in Sitecore?

Answer: Performance counters initialization:
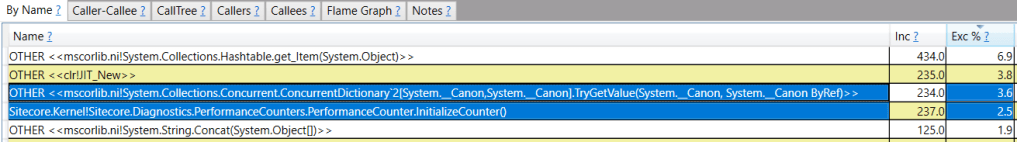
Yes, that’s right, those performance counters which are powered by OS and super fast.
Although Sitecore counter init implementation does not look offensive (volatile read & interlocked), counters are everywhere (cache lookup / access / object creation):
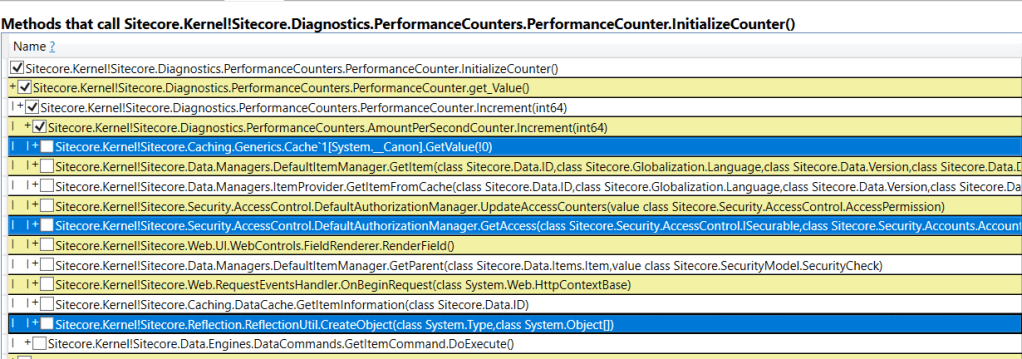
Considering server concurrently runs N threads & each updates memory == huge impact.
Benchmark time: VTune time
Intel VTune shows performance counters init code is translated into lock cmpxchg:
if (initialized != 1 && Thread.VolatileRead(ref initialized) != 1 && Interlocked.CompareExchange(ref initializingCounter, 1, 0) != 1 && AllowConnect)

Sync between all the cores & writes on each go to the memory leads to almost five times lower processor efficiency [CPI] on the surface (theoretical x5 slow down):

In simple words: Intel I7 with 8 cores performs as 2014 Intel 2-core I3.
How big is the win without interlocked?
Changing the conditions order (counters are never initialized if disabled in config) improves processor efficiency 15 times (4,6 vs 0.46):
                if (AllowConnect == false)
                {
                    return;
                }

                if (initialized != 1 && Thread.VolatileRead(ref initialized) != 1 && Interlocked.CompareExchange(ref initializingCounter, 1, 0) != 1)
                {....

No memory writes == no memory-bound bottleneck:
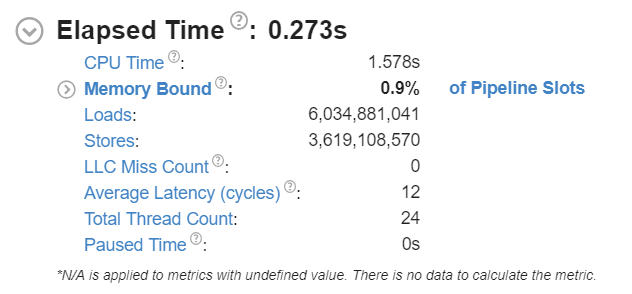
Conclusions
The execution time dropped 22 times (5.8 -> 0.27 sec) just by preventing reckless interlocked operations on each go.

Could you please point me to the class where the fix proposed by you should be applied?
LikeLike
Sitecore.Diagnostics.PerformanceCounters.PerformanceCounterclass, insideInitializeCountermethod.LikeLike