Agenda: All of sudden your Application starts responding slow. What to do? In order to figure out why it is slow, you’ll need to understand what happens internally, what does each thread do? How the wallclock time is spent while processing your request? The source of that data is dynamic profiling. Azure WebApps can collectContinue reading “Collecting performance profiles in Azure WebApps on demand”
Tag Archives: Performance
Is docker file system slow?
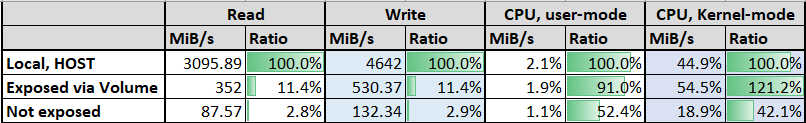
How slow could file system be in docker?
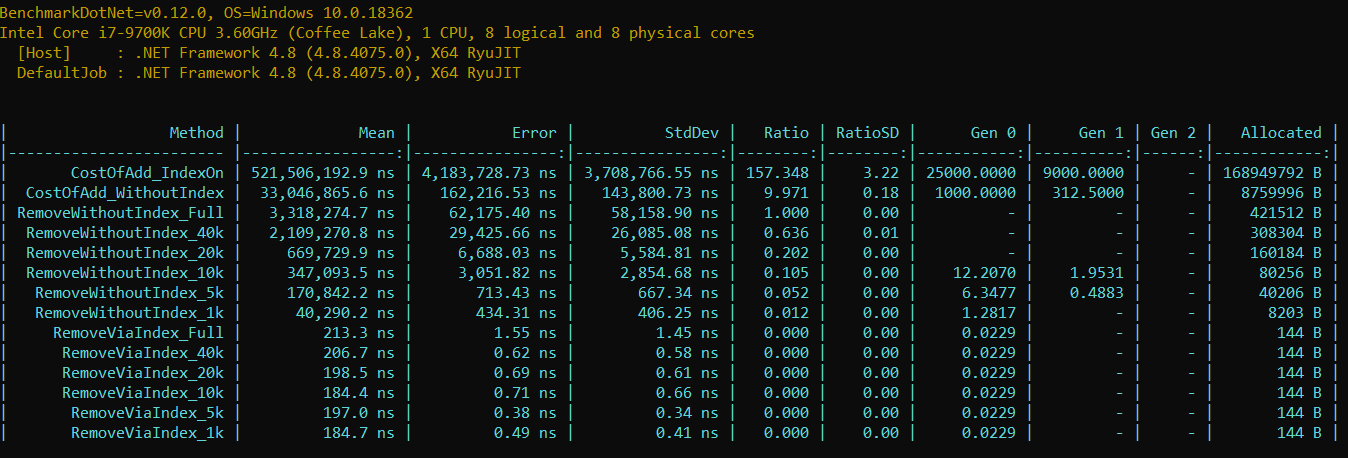
Performance crime: Params
You might heard params are evil. Have you ever seen the performance bill for that? How to find out where params are used? Memory allocation report shows all allocations, we’ll start from here: Method with params creates an array behind the scenes, so hunting for object[]: IL code proves sad truth – array is alwaysContinue reading “Performance crime: Params”
Reckless interlocked operations
Let’s start with a guess – what is the most CPU-heavy operation in Sitecore? Answer: Performance counters initialization: Yes, that’s right, those performance counters which are powered by OS and super fast. Although Sitecore counter init implementation does not look offensive (volatile read & interlocked), counters are everywhere (cache lookup / access / object creation):Continue reading “Reckless interlocked operations”
Case study: database optimization
The story how query optimization can influence the overall database performance.
Performance crime: concurrent collections misuse
The case study on how the harmless collection could silently cause system to work slower and remain undetected for ages.
Performance crime: config to kill performance
Would you as a developer allow a setting that can make system 15 550 times slower? I’ve received a few memory dumps with high CPU; each scavenges AccessResultCache: How big is the cache so that every snapshot contains the operation? Detecting cache size from the snapshot A ClrMD code snippet locates objects in Sitecore.Caching.Generics.Cache namespaceContinue reading “Performance crime: config to kill performance”
Performance crime: no respect for mainstream flow
How expensive a lack of respect to mainstream usage could be?
Why server-side is slow?
How to answer ‘why slow’ question?
#PerfView, #Sitecore
Do you pay the performance price for non used features?
The general assumption is – not using a feature/functionality means no performance price is payed. How far do you agree?
