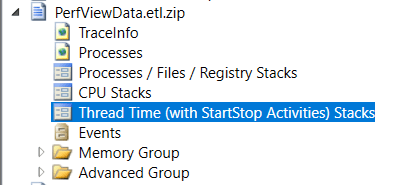
We have profiled application start in the previous post, and will carry on wall clock time investigation; let’s start by looking at Thread Time report:
First thing to notice – a set of processes running next to w3wp:
- CSC is a compilation effort, every entry takes ~4.6 seconds at least (delays application start as well)
- Robocopy util that deals with files sync

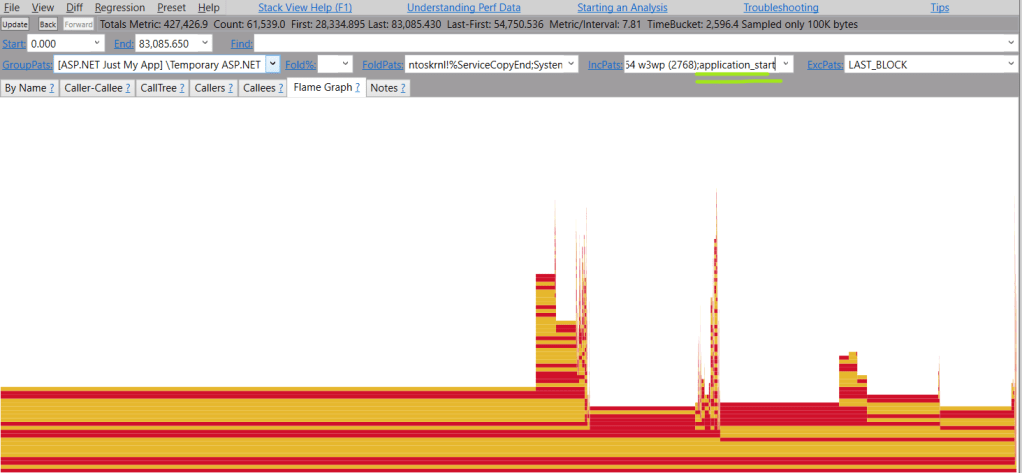
Selecting a flame graph for w3wp seems quite sparse so far with little of use:

That happens as all threads are displayed now without filtering. Let’s include only application_start -related entries by expanding IncPats filter:
Application_Start in call stackLet’s hide/fold tiny bits that are <4% of time to get a high-level understanding:
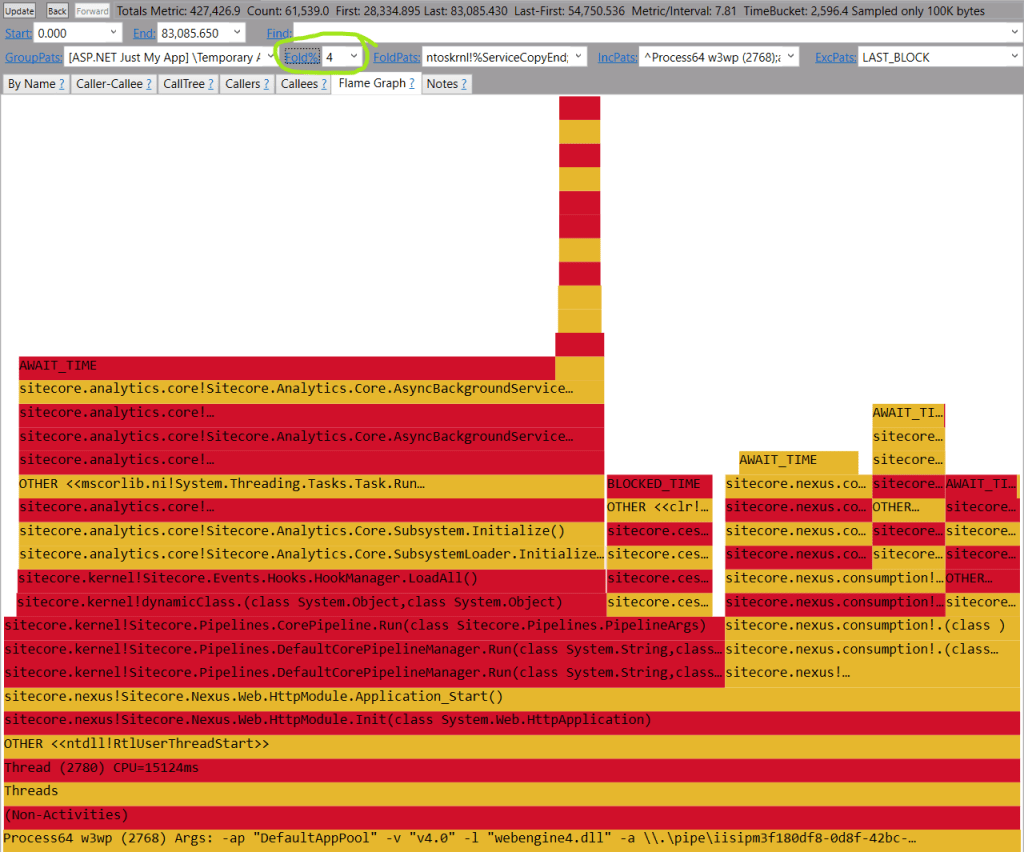
Fold–ing method wrappers to get a cleaner output:
dynamicclass– a runtime wrapper around Sitecore config processorCorePipeline– a runtime wrapper around Sitecore pipelinesReflection– .NET reflection to invoke methods/props

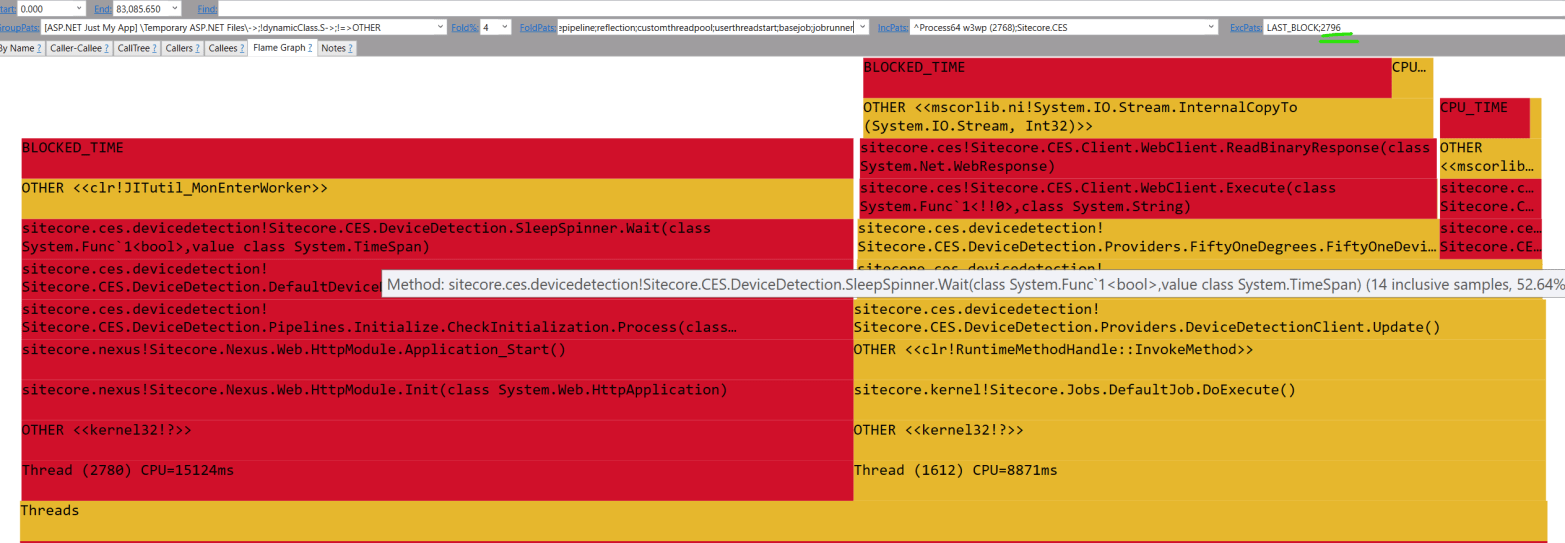
The top-right method belongs to Sitecore.CES, let’s focus on it by changing IncPats:

There are 3 threads on the picture (the second frame from bottom divided into three):
- 2796: Sleeps all the time, does not add any value; can be skipped
- 2780: Application_Start thread is blocked until initialization is done
- 1612: Performs initialization
Removing 2796 from view by adding it to ExcPats:

It seem that Sitecore attempts to load device database to file system whenever container is created, which takes ~23 seconds of startup time.
The solution is simple – persist device detection folder via docker.compose:
- .\data\cm\DeviceDetection:C:\inetpub\wwwroot\App_Data\DeviceDetection
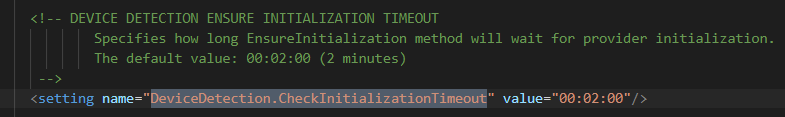
Secondly, the DeviceDetection initialization wait timeout could be reduced to a single second via setting change in a local/dev sandbox:
Peeling off already resolved
After Sitecore.CES impact on startup was eliminated, further application_Start investigation (excluding Sitecore.CES from view via ExcPats) could be carried on:

Further steps
Over 87% time in await likely indicates some room for improvement:
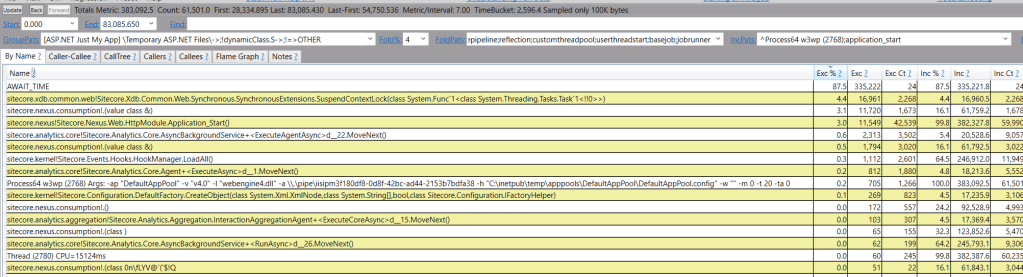
Every remaining flame bar is to be inspected (in a similar manner as we did just now) to understand if there is a potential to do better.
