Performance is like carrying a bowl of water:
On the one hand loosing a few drops seem not a big deal.
On the other hand you are running out of water drop-by-drop.
Performance investigations
Performance is like carrying a bowl of water:
On the one hand loosing a few drops seem not a big deal.
On the other hand you are running out of water drop-by-drop.
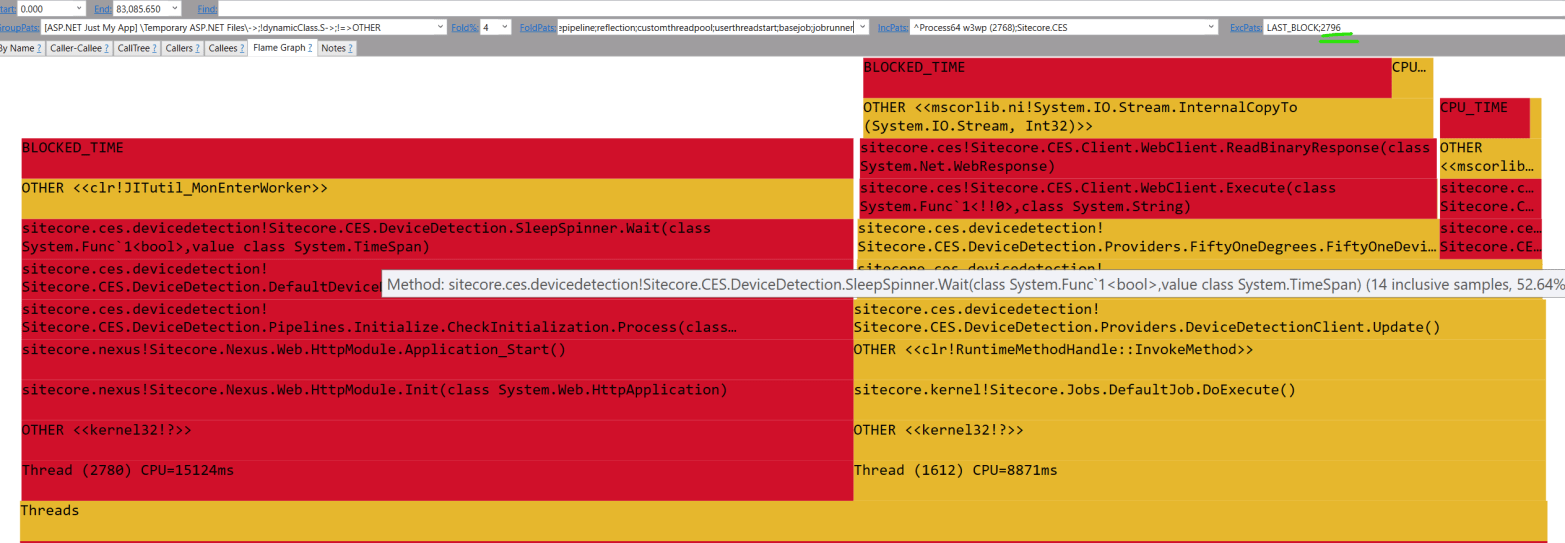
We have profiled application start in the previous post, and will carry on wall clock time investigation; let’s start by looking at Thread Time report: First thing to notice – a set of processes running next to w3wp: CSC is a compilation effort, every entry takes ~4.6 seconds at least (delays application start as well)Continue reading “Reviewing docker performance profile”
You might heard params are evil. Have you ever seen the performance bill for that? How to find out where params are used? Memory allocation report shows all allocations, we’ll start from here: Method with params creates an array behind the scenes, so hunting for object[]: IL code proves sad truth – array is alwaysContinue reading “Performance crime: Params”
I was investigating Sitecore Aggregation case a time back and my attention was caught by GC Heap Allocation mentioning RequiresValidator in top 10: Combining all generic entries together leads to over 7% of total allocations making it second most expensive type application wide! Yes, all it does is check object is not null Yes, itContinue reading “Performance crime: careless allocations”
Performance Engineering of Software Systems MIT course begins with optimizing math task code to make it work 53K times faster.
How faster can real-life software become without changing the technology?