I know 2 ways of answering this question.
One steals time with no results, while another one leads to correct answer.
First: Random guess
Slow as caches are too small, we need to increase themSlow as server isn't powerful enough, we need to get a bigger box
Characteristics:
- Based on past experience (cannot guess something never faced before)
- Advantage: Does not require any investigation effort
- Disadvantage: As accurate as shooting in the forest without aiming
Second: Profile code execution flow
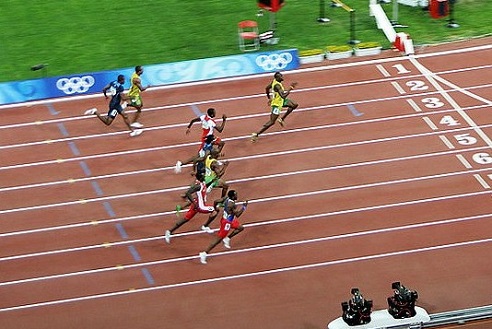
The dynamic profiling is like a video of 200 meter sprint showing:
- How fast each runner is
- How much time does it take for each runner to finish
- Are there any obstacles on the way?
Collecting dynamic code profile
PerfView is capable of collecting the data in 2 clicks, so all you need to do is:
- Download the latest PerfView release, updated quite often
- Run as admin
- Click collect & check all the flags
- Stop in 20 sec
Downloading PerfView
Even though I hope my readers are capable of downloading files from link without help, I would drop an image just in case:
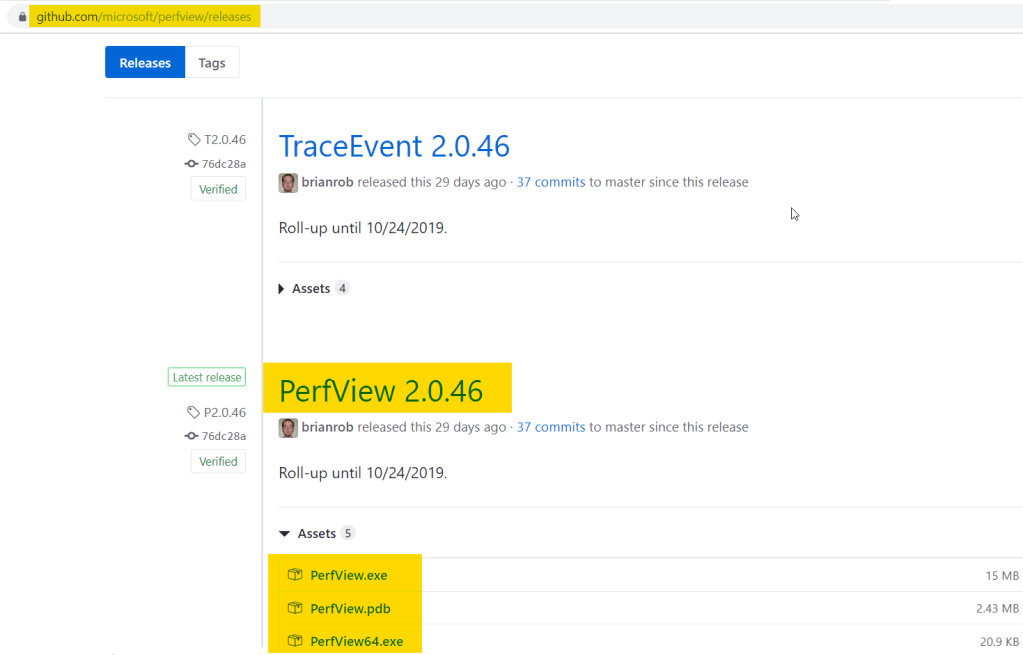
Ensure to download both PerfView and PerfView64 so any bitness could be profiled.
Running the collection
- Launch
PerfView64as admin user on the server - Top menu:
Collect -> Collect - Check all the flags (
Zip&Merge&Thread Time) - Click
Start collection - Click
Stop collectionin ~20 seconds
Collect 3-4 profiles to cover different application times.
The outcome is flame graph showing the time distribution:
Summary
The only way to figure out how the wall clock time is distributed is to analyze the video showing the operation flow. Everything else is a veiled guessing-game.
