I was investigating Sitecore Aggregation case a time back and my attention was caught by GC Heap Allocation mentioning RequiresValidator in top 10:

Combining all generic entries together leads to over 7% of total allocations making it second most expensive type application wide!
- Yes, all it does is check
object is not null - Yes, it can be replaced by
if (obj is null) throwNOT doing any allocations - Yes, it is initialized more than any other Sitecore class
- Yes, it costs half of application-wide string allocations
What are the birth patterns?
Locating constructor usages via iLSpy does not help as the class referenced everywhere. Luckily, PerfView can show the birth call stacks:
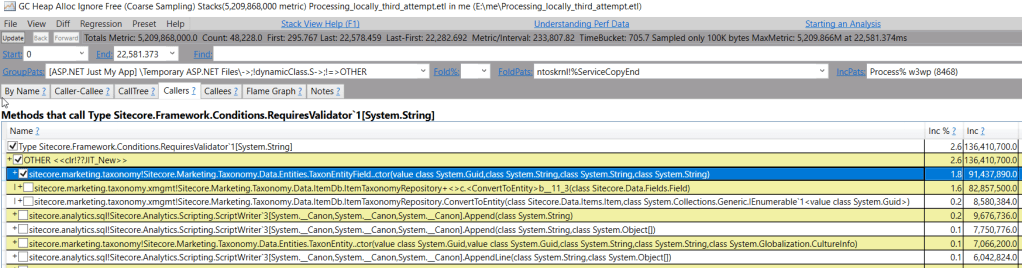

The Sitecore.Marketing.Taxonomy.Data.Entities.TaxonEntityField is a main parent. We’ve seen from past articles that memory allocations can become costly, but how costly are they here?
Benchmark time
The action plan is to create N objects (so that allocations are close to PerfView stats), and measure time/memory for stock version VS hand-written one.
Null check still remains via extension method:
        public static Guid Required(this Guid guid)
        {
            if (guid == Guid.Empty) throw new Exception();

            return guid;
        }

        public static T Required<T>(this T value) where T : class
        {
            if (value is null) throw new Exception();

            return value;
        }
Benchmark.NET performance test code simply creates a number of objects:
    [MemoryDiagnoser]
    public class TestMarketingTaxonomies
    {
        public readonly int N = 1000 * 1000;

        private readonly Guid[] Ids;
        private readonly Guid[] taxonomyId;
        private readonly string[] type;
        private readonly string[] uriPath;
        private readonly CultureInfo[] culture;

        private readonly CultureInfo info;
        private readonly TaxonEntity[] stockTaxons;
        private readonly FasterEntity[] fasterTaxons;
        public TestMarketingTaxonomies()
        {
            info = Thread.CurrentThread.CurrentCulture;

            stockTaxons = new TaxonEntity[N];
            fasterTaxons = new FasterEntity[N];

            Ids = new Guid[N];
            taxonomyId = new Guid[N];
            type = new string[N];
            uriPath = new string[N];
            culture = new CultureInfo[N];

            for (int i = 0; i < N; i++)
            {
                var guid = Guid.NewGuid();
                var text = guid.ToString("N");
                Ids[i] = guid;
                taxonomyId[i] = guid;
                type[i] = text;
                uriPath[i] = text;
                culture[i] = info;
            }
        }

        [Benchmark]
        public void Stock()
        {
            for (int i = 0; i < N; i++)
            {
                var taxon = new TaxonEntity(Ids[i], Ids[i], type[i], uriPath[i], info);
                stockTaxons[i] = taxon;
            }
        }

        [Benchmark]
        public void WithoutFrameworkCondtions()
        {
            for (int i = 0; i < N; i++)
            {
                var taxon = new FasterEntity(Ids[i], Ids[i], type[i], uriPath[i], info);
                fasterTaxons[i] = taxon;
            }
        }
    }
Local Results show immediate improvement
3 times less memory allocated + two times faster without RequiresValidator:
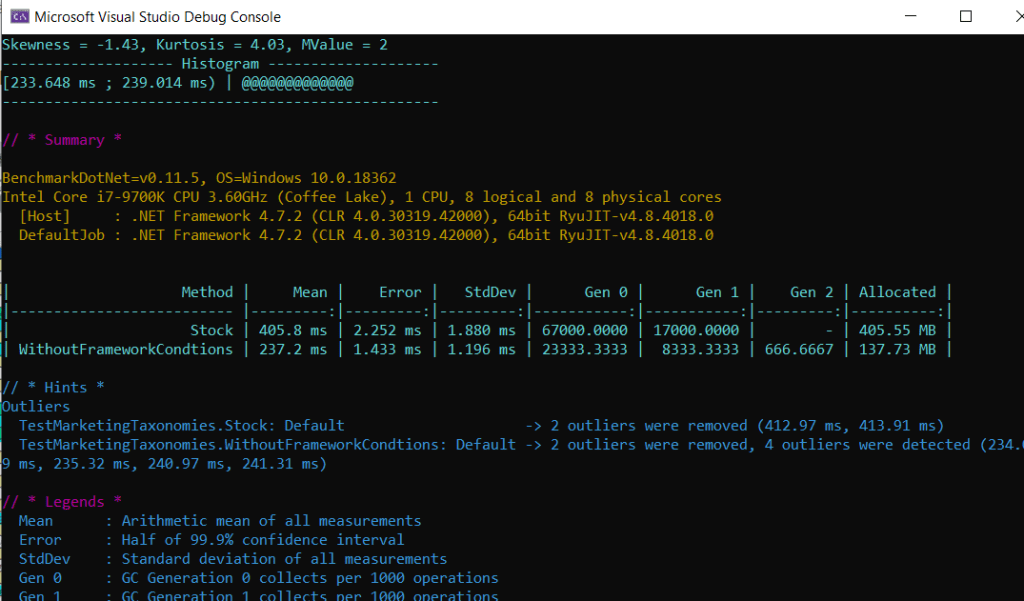
Think about numbers a bit; it took 400ms. on an idle machine with:
- High-spec CPU with CPU speed up to 4.9 GHz
- No other ongoing activities – single thread synthetic test
- Physical machine – the whole CPU is available
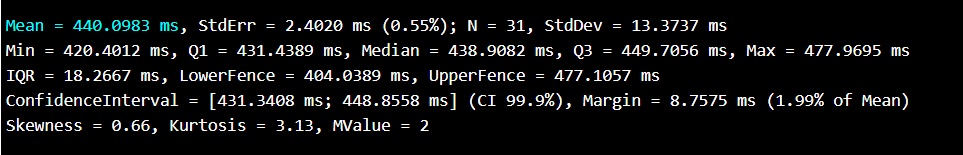
How fast that would be in Azure WebApp?
At least 2 times slower (405 VS 890 ms):

Optimized version remains 2 times faster at least:
What about heavy loaded WebApp?
It will be slower on a loaded WebApp. Our test does not take into account extra GC effort spent on collecting garbage. Thereby real life impact shall be even greater.
Summary
Tiny WebApp with optimized code produces same results as twice as powerful machine.
Each software block contributes to overall system performance. The slowness can either be solved by scaling hardware, or writing programs that use existing hardware optimal.
