Agenda: All of sudden your Application starts responding slow. What to do?
In order to figure out why it is slow, you’ll need to understand what happens internally, what does each thread do? How the wallclock time is spent while processing your request? The source of that data is dynamic profiling.
Azure WebApps can collect performance profiles on demand in KUDU advanced tools:
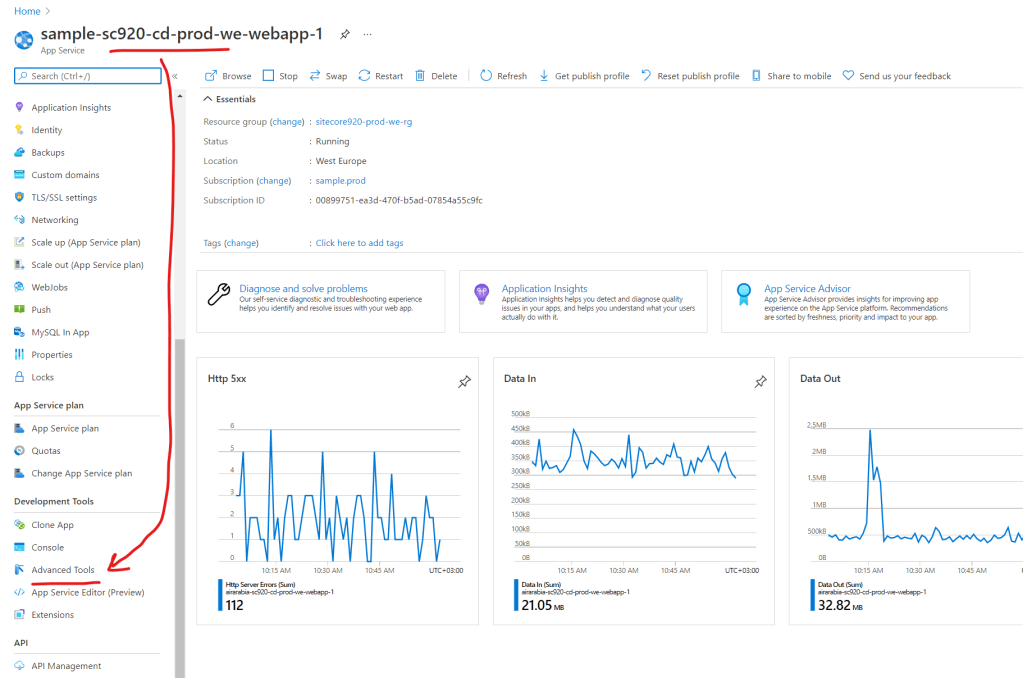
Advanced Tools (aka Kudu) provides a collection of developer oriented tools and extensibility points for your App Service Apps.
Profiler should be switched on for half a minute from Process Explorer view:
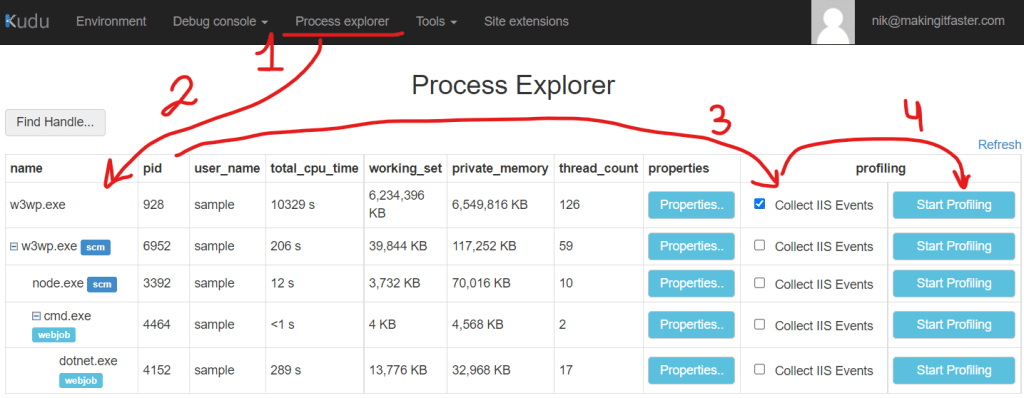
It just takes a few steps to perform the collection:
- Once Kudu is opened, switch to
Process Explorertab - Select
w3wp.exein the list of processes (not the one with scm as it stands for KUDU ui) - Ensure to check
Collect IIS Events - Click
Start Profiling - Wait for 20-30 seconds
- Click
Stop Profiling
Wait for a minute to let instance-name-process.diagsession to be produced and downloaded. That is much much simpler than collecting performance profiles in Docker.
Once the performance profile is downloaded, we can jump to analysis with a help of PerfView.
For extreme cases (application turns unresponsive at all) collection shall time out, you’ll need to collect a few sequential memory snapshot and inspect what does each thread do.
