Problem statement The application experienced a gradual increase in memory usage over the years, becoming notably problematic when it reached 20 GB of RAM. Although memory snapshots revealed that more than 90 million custom objects were in memory, developers asserted all these objects were being utilized, owing to intricate business rules and calculations within theContinue reading “Performance crime: Non-unique strings”
Category Archives: Investigation
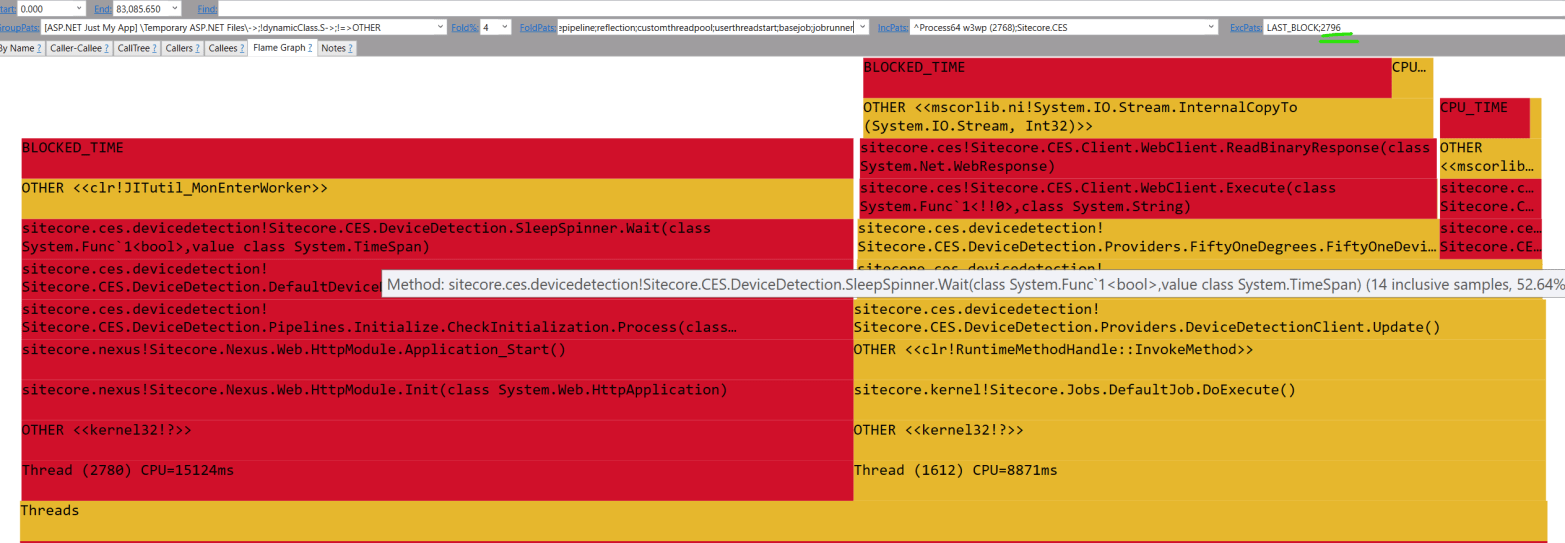
Performance crime: Reflection
Problem statement Commerce customer with phantom slowness recently asked for help – random API duration spikes. Introduction – not as easy Enabling pipeline tracing was not much of use due to: A sole commerce flow API produced over 5.6K lines in log in test environment, which must have landed with extra cost due to observerContinue reading “Performance crime: Reflection”
Collecting performance profiles in Azure WebApps on demand
Agenda: All of sudden your Application starts responding slow. What to do? In order to figure out why it is slow, you’ll need to understand what happens internally, what does each thread do? How the wallclock time is spent while processing your request? The source of that data is dynamic profiling. Azure WebApps can collectContinue reading “Collecting performance profiles in Azure WebApps on demand”
Memory snapshots in Azure Web Apps
A memory snapshot could explain why an app does not behave well. The process of collecting memory snapshot is straightforward locally: Download ProcDump Find the process ID in Task Manager Trigger onDemand collection: procdump.exe -accepteula -ma 123 Why that does not work in cloud? Despite KUDU can generate memory snapshots on demand, it frequently failsContinue reading “Memory snapshots in Azure Web Apps”
Performance crime: Concat
Are you joining strings here and there in the code base? The story about improper string concat usage.
Make unit tests public
Public unit tests for framework is win-win both for vendor, and framework consumers. My top 5 reasons for that. Led by example: Unicorn Unicorn is popular serialization mechanism with > 1.3M Nuget downloads! All you need to get started is to download the package and read readme. Custom requirements (f.e. store only specific part ofContinue reading “Make unit tests public”
Performance crime: hidden culture-specific parsing

Performance is like carrying a bowl of water:
On the one hand loosing a few drops seem not a big deal.
On the other hand you are running out of water drop-by-drop.
Reviewing docker performance profile
We have profiled application start in the previous post, and will carry on wall clock time investigation; let’s start by looking at Thread Time report: First thing to notice – a set of processes running next to w3wp: CSC is a compilation effort, every entry takes ~4.6 seconds at least (delays application start as well)Continue reading “Reviewing docker performance profile”
Performance in Docker

How to check application performance inside container?
Performance crime: Params
You might heard params are evil. Have you ever seen the performance bill for that? How to find out where params are used? Memory allocation report shows all allocations, we’ll start from here: Method with params creates an array behind the scenes, so hunting for object[]: IL code proves sad truth – array is alwaysContinue reading “Performance crime: Params”
