Have you ever wondered how to make system run faster in container?

PerfView is the tool to measure performance, right. Being a UI-based application running on top of Windows Event Tracing sounds to be irrelevant for containers, or no?
How could it work?
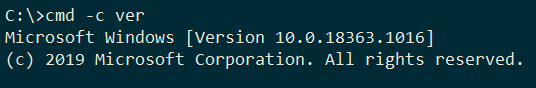
Operating system has to virtualize the events and forward them to the ETW session in the appropriate container. Since containers and the underlying host share a single kernel, the container’s base image OS version must match that of the host. If the versions are different, the container may start, but full functionally isn’t guaranteed:

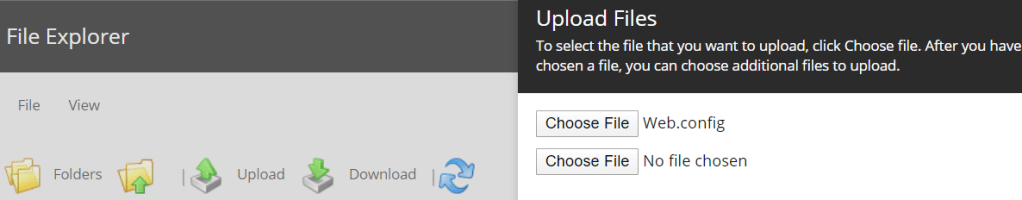
Step one: Copy PerfView into container
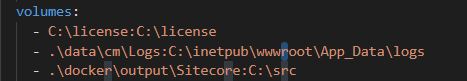
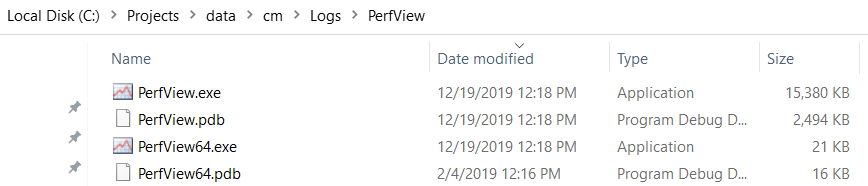
Copy PerfView files via volume mechanism; I’ll re-use logs folder for sake of speed:
Step two: Connect to container with cmd
List running containers via docker container ls:

And connect to the Sitecore instance to profile (CM in our case) via docker exec -i -t [container_id] cmd command.
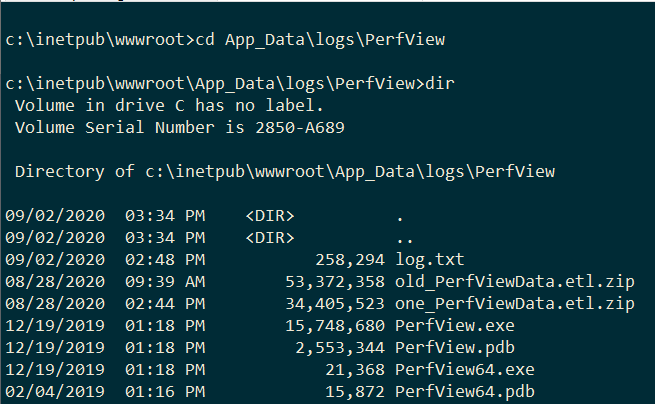
Switch to exposed folder and verify PerfView is inside container:
Step three: Trigger collection
Prepare the scenario you want to profile, and trigger profiling via command:
PerfView.exe /AcceptEULA /threadTime /logFile=log.txt /LowPriority /maxCollectSec=80 collect -Providers:AFF081FE-0247-4275-9C4E-021F3DC1DA35,DD5EF90A-6398-47A4-AD34-4DCECDEF795F,7B6BC78C-898B-4170-BBF8-1A469EA43FC5
ETW providers installed inside container: logman query providers

Step four: Is collection running?
Even though it might look like nothing has happened upon invoking the PerfView, it is collecting stuff that is confirmed by log.txt:
PerfView logging started at 9/2/2020 3:55:31 PM
[EXECUTING: PerfView /AcceptEULA /threadTime /logFile=log.txt /LowPriority /maxCollectSec=80 collect -Providers:AFF081FE-0247-4275-9C4E-021F3DC1DA35,DD5EF90A-6398-47A4-AD34-4DCECDEF795F,7B6BC78C-898B-4170-BBF8-1A469EA43FC5]
Circular buffer size = 0, setting to 500.
[Kernel Log: C:\inetpub\wwwroot\App_Data\logs\PerfView\PerfViewData.kernel.etl]
Kernel keywords enabled: ThreadTime
[User mode Log: C:\inetpub\wwwroot\App_Data\logs\PerfView\PerfViewData.etl]
Enabling Provider:PerfViewLogger Level:Verbose Keywords:0xffffffffffffffff Stacks:0 Values: Guid:a8a71ac1-040f-54a2-07ca-00a89b5ab761
Turning on more CLR GC, JScript and ASP.NET Events.
What it was doing is launching the GUI, which you don’t see, and detaching from the current console. The profile becomes visible in PerfView folder once collection is done:

Result confirmation
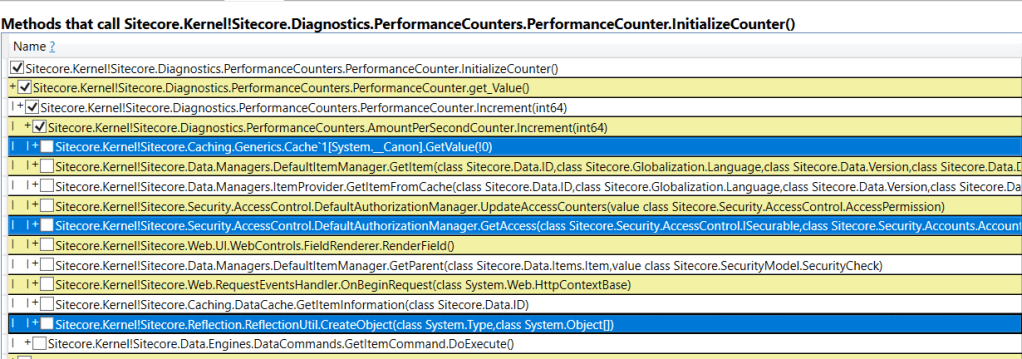
A quick look into flame graph shows some potential slow points to be addressed:
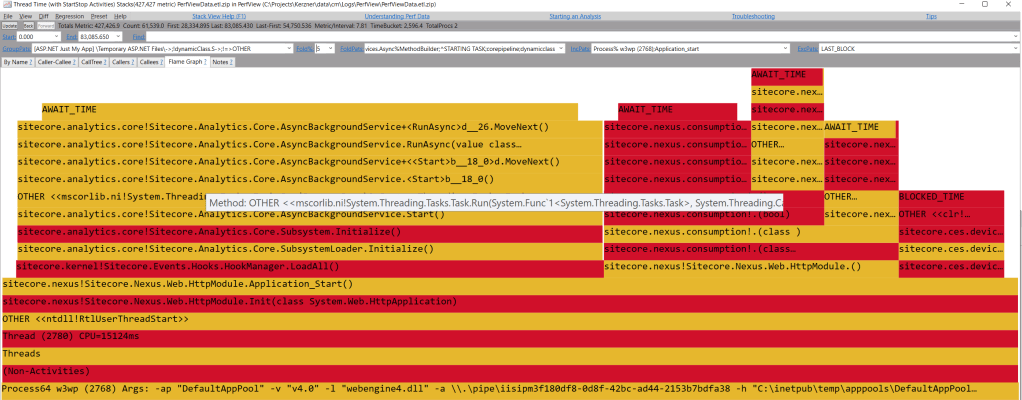
- The leftmost bar is DeviceDetection costing 10 % (or ~5.5 seconds) of time
- Middle bar is Nexus licensing check taking ~30 % (or ~16 seconds) of time
- The first bar is Analytics subsystem start taking ~57% (or ~30 seconds) of time
Definitely, the profile needs a deeper look in a separate article.
Summary
PerfView collection inside container runs in the same manner as in old good days, except lack of user interface. The only difference is usage of command line arguments.
All you need to do is copy PerfView inside container & launch it in correct point in time (slow operation).