Would you as a developer allow a setting that can make system 15 550 times slower?
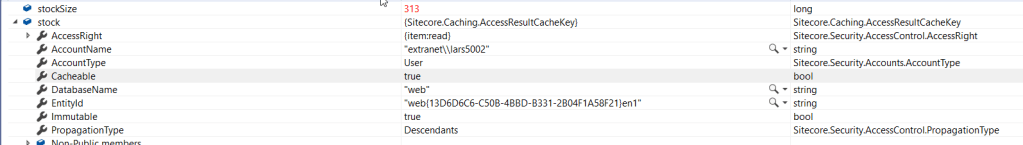
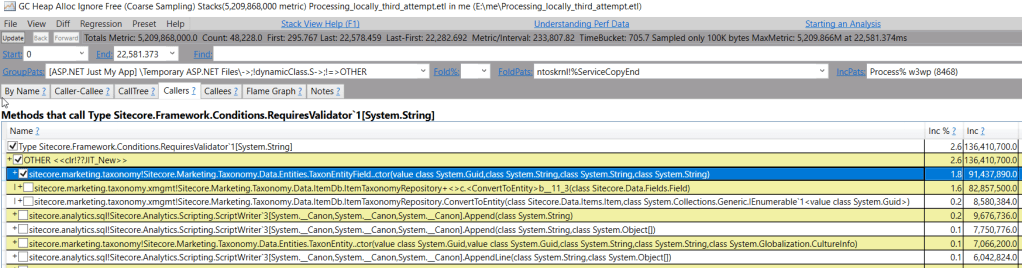
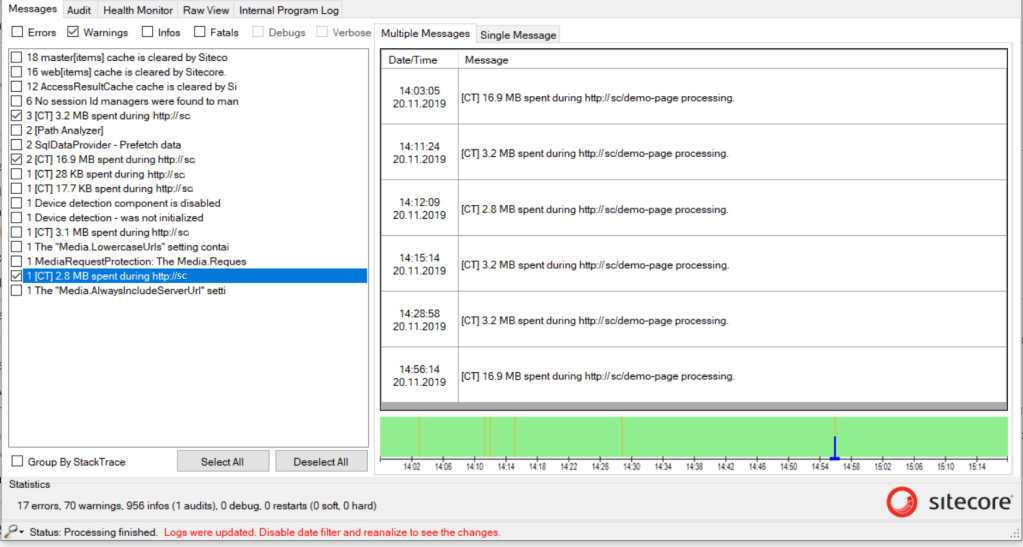
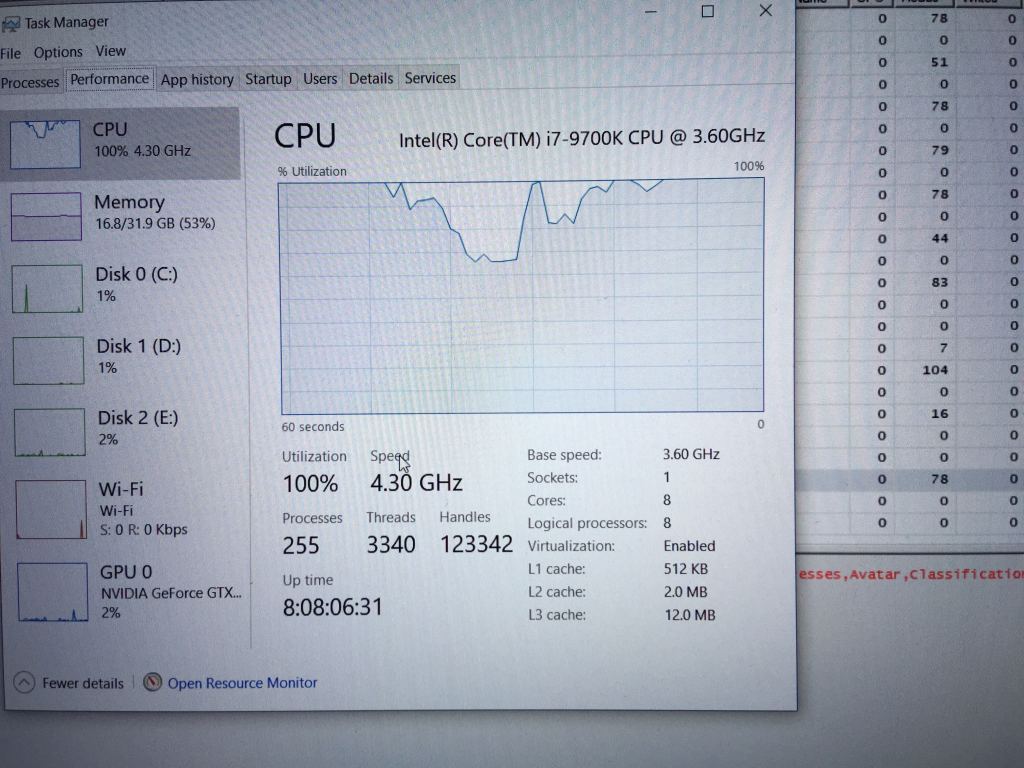
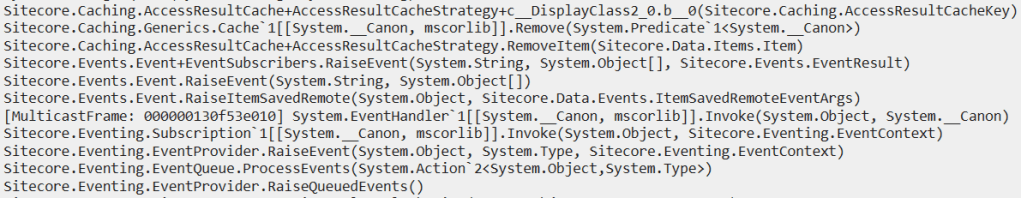
I’ve received a few memory dumps with high CPU; each scavenges AccessResultCache:
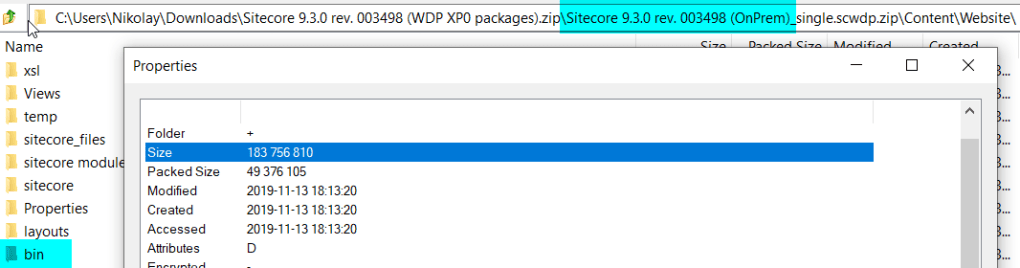
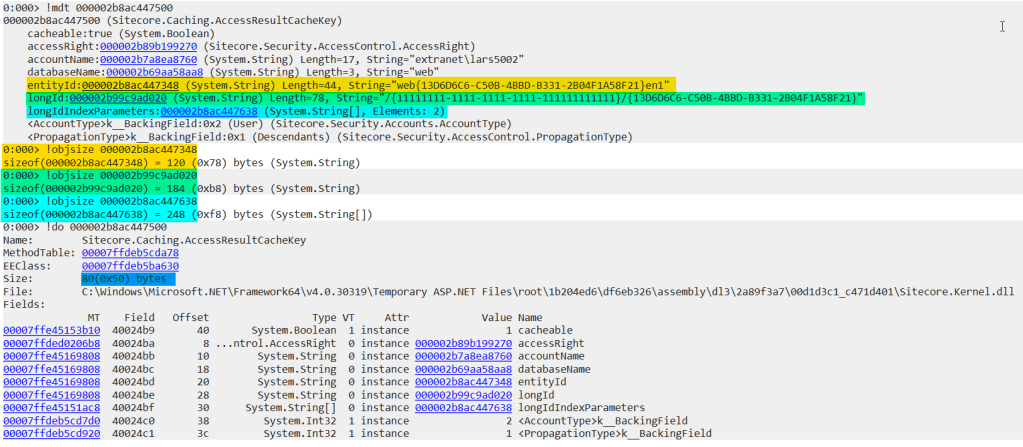
How big is the cache so that every snapshot contains the operation?
Detecting cache size from the snapshot
A ClrMD code snippet locates objects in Sitecore.Caching.Generics.Cache namespace with cache-specific fields & showing only filled caches:
            using (DataTarget dataTarget = DataTarget.LoadCrashDump(snapshot))
            {
                ClrInfo runtimeInfo = dataTarget.ClrVersions[0];
                ClrRuntime runtime = runtimeInfo.CreateRuntime();
                var heap = runtime.Heap;
                var stats = from o in heap.EnumerateObjects()
                            let t = heap.GetObjectType(o)
                            where t != null && t.Name.StartsWith("Sitecore.Caching.Generics.Cache")
                            let box = t.GetFieldByName("box")
                            where box != null
                            let name = o.GetStringField("name")
                            let maxSize = o.GetField<long>("maxSize")
                            let actualBox = o.GetObjectField("box")
                            let currentSize = actualBox.GetField<long>("currentSize")
                            where maxSize > 0
                            where currentSize > 0
                            let ratio = Math.Round(100 * ((double)currentSize / maxSize), 2)
                            where ratio > 40
                            orderby ratio descending, currentSize descending
                            select new
                            {
                                name,
                                address = o.Address.ToString("X"),
                                currentSize = MainUtil.FormatSize(currentSize, false),
                                maxSize = MainUtil.FormatSize(maxSize, false),
                                ratio
                            };

                foreach (var stat in stats)
                {
                    Console.WriteLine(stat);
                }
            }
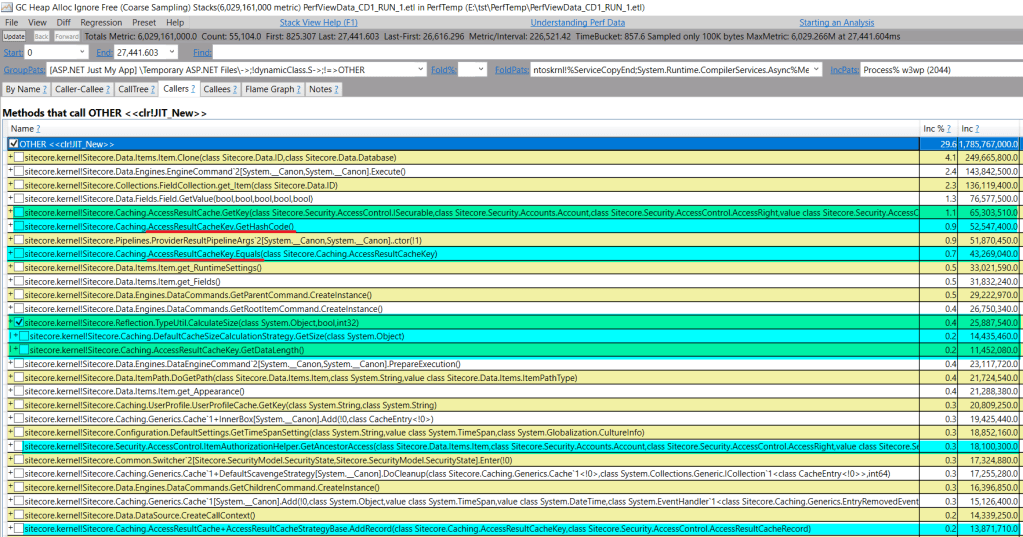
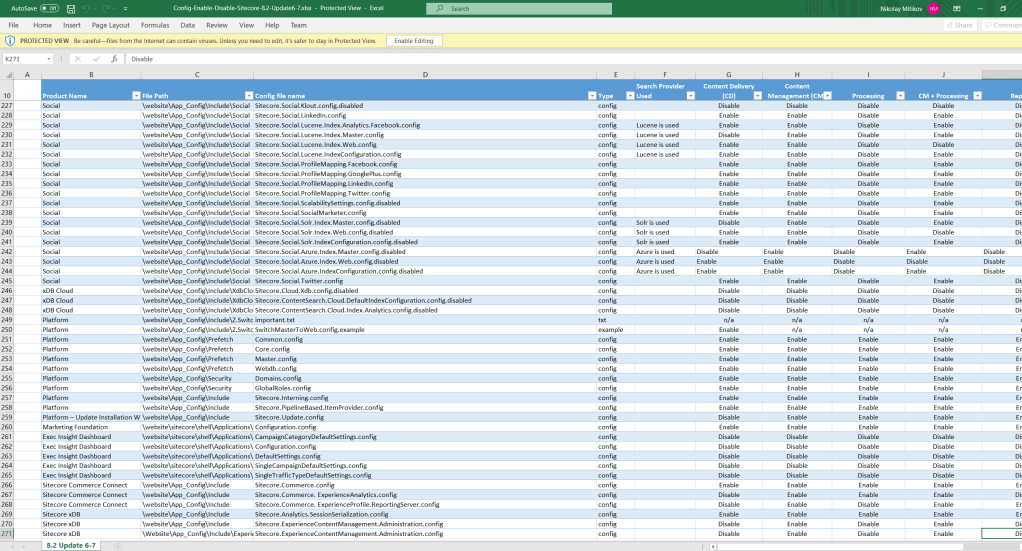
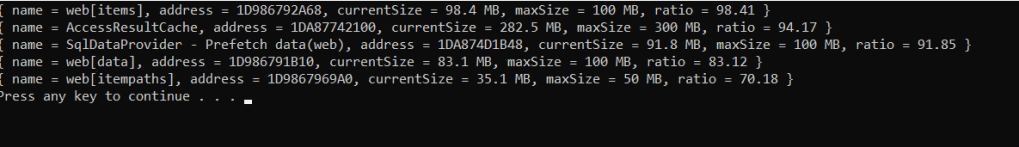
There are 5 caches that are running out of space, and AccessResultCache is one of them with 282MB running size vs 300 MB allowed:
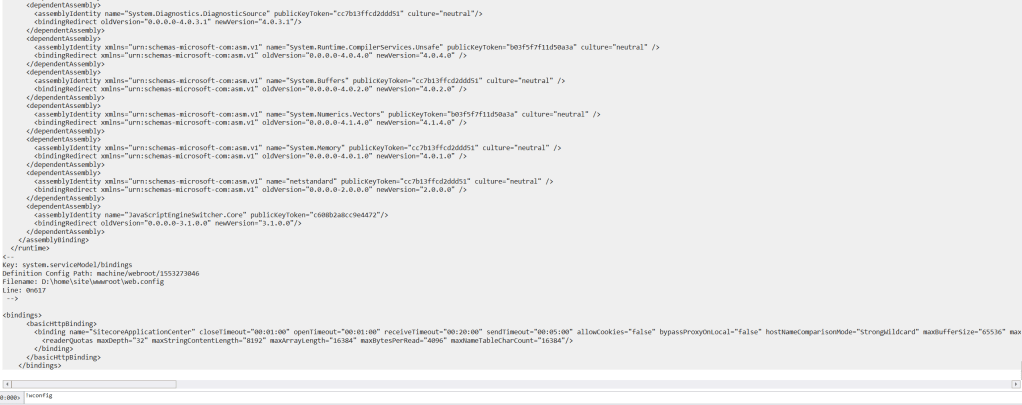
Fetched runtime Sitecore config from snapshot proves 300 MB max size:
<setting name="Caching.AccessResultCacheSize" value="300MB"/>
Configuration to control cleanup logic
The Caching.CacheKeyIndexingEnabled.AccessResultCache setting controls how cache is scavenged:
Using indexed storage for cache keys can in certain scenarios significantly reduce the time it takes to perform partial cache clearing of the AccessResultCache. This setting is useful on large solutions where the size of this cache is very large and where partial cache clearing causes a measurable overhead.
Sitecore.Caching.AccessResultCache.IndexedCacheKeyContainer is plugged in should cache key indexing be enabled. The index is updated whenever element is added so that all elements belonging to an item can be easily located. A bit higher price for adding an element in exchange of a faster scavenge.
What is performance with different setting values?
We’ll do a series of Benchmark.NET runs to cover the scenario:
- Extract all in memory
AccessResultCacheKeys (reuse code snipped from How much faster can it be) - Mimic
AccessResultCacheinner store & load keys into it - Trigger logic to remove element with & without index
- Measure how fast elements are added with & without index
- Measure speed for different sizes
Load keys into AccessResultCache inner storage
Default storage is ConcurrentDictionary; cleanup is a predicate for every cache key:
        private readonly ConcurrentDictionary<FasterAccessResultCacheKey, string> fullCache = new ConcurrentDictionary<FasterAccessResultCacheKey, string>();
        private readonly IndexedCacheKeyContainer fullIndex = new IndexedCacheKeyContainer();

        public AccessResultCacheCleanup()
        {
            foreach (var key in keys)
            {
                        cache.TryAdd(key, key.EntityId);
                        index.UpdateIndexes(key);
            }
        }

        private void StockRemove(ConcurrentDictionary<FasterAccessResultCacheKey, string> cache)
        {
            var keys = cache.Keys;
            var toRemove = new List<FasterAccessResultCacheKey>();
            foreach (var key in keys)
            {
                if (key.EntityId == keyToRemove)
                {
                    toRemove.Add(key);
                }
            }

            foreach (var key in toRemove)
            {
                fullCache.TryRemove(key, out _);
            }
        }

        public void RemoveViaIndex(ConcurrentDictionary<FasterAccessResultCacheKey, string> cache, IndexedCacheKeyContainer index)
        {
            var key = new FasterAccessResultCacheKey(null, null, null, keyToRemove, null, true, AccountType.Unknown, PropagationType.Unknown);

            var keys = index.GetKeysByPartialKey(key);

            foreach (var toRemove in keys)
            {
                cache.TryRemove(toRemove, out _);
            }

            index.RemoveKeysByPartialKey(key);
        }
Measuring add performance
Index maintenance needs additional efforts, hence add speed should be also tested:
        [Benchmark]
        public void CostOfAdd_IndexOn()
        {
            var cache = new ConcurrentDictionary<FasterAccessResultCacheKey, string>();
            var index = new IndexedCacheKeyContainer();
            long size = 0;
            foreach (var key in Keys)
            {
                index.UpdateIndexes(key);
                size += key.GetDataLength();
            }
        }

        [Benchmark]
        public void CostOfAdd_WithoutIndex()
        {
            var cache = new ConcurrentDictionary<FasterAccessResultCacheKey, string>();
            long size = 0;
            foreach (var key in Keys)
            {
                cache.TryAdd(key, key.EntityId);
                size += key.GetDataLength();
            }
        }
Taking into account different cache sizes
Configured 300 MB is 7 .5 times larger than default cache value (40 MB in 9.3), it makes sense to measure timings for different key count as well (58190 keys = 282 MB):

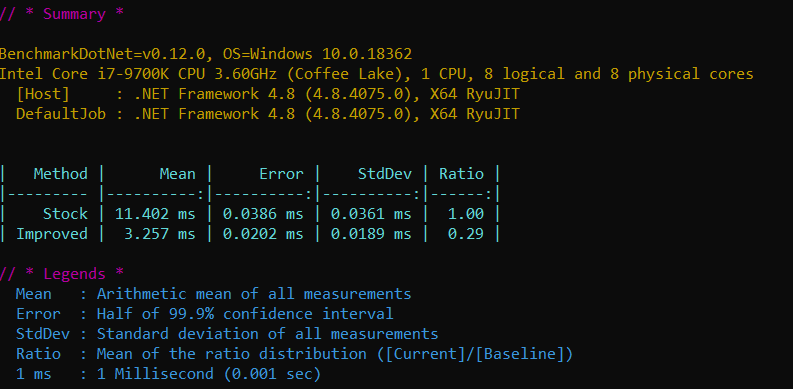
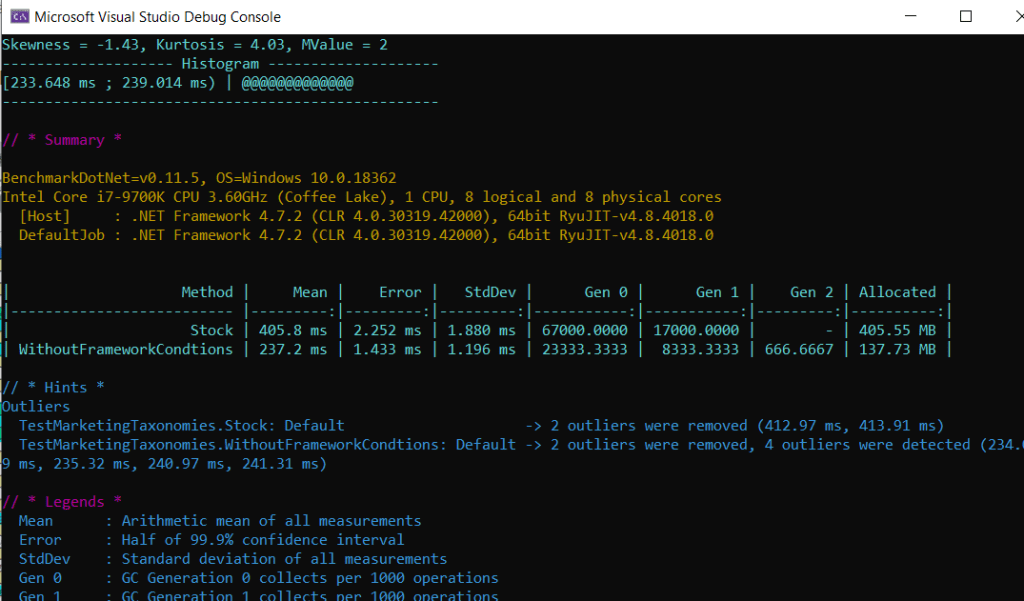
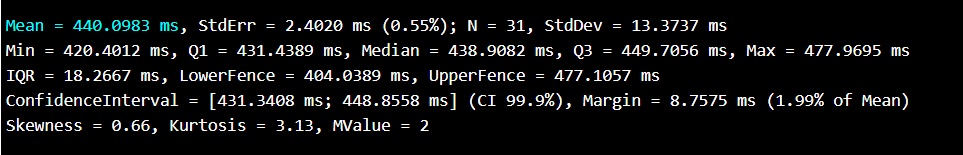
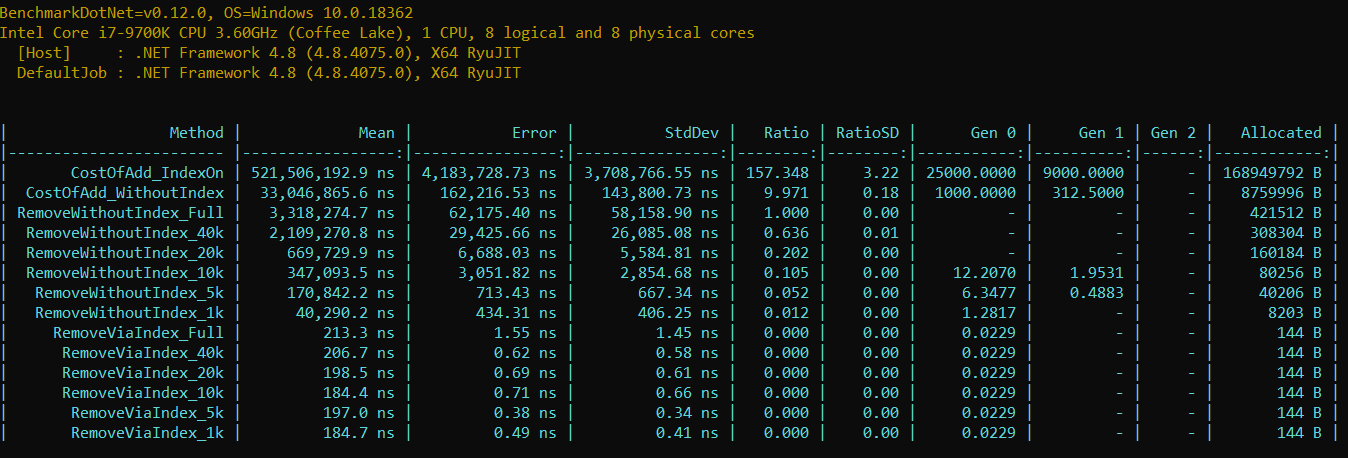
Understanding the results
- Removing element without index takes 15 550 times more
- An attempt to remove element costs ~400 KB memory pressure
- It takes 3.8 ms for a single removal on IDLE system with 4.8 GHz super CPU
- Prod solution in cloud (constant cache hits) shall take ~4 times more
- Up to 8.4K entries can squeeze into OOB AccessResultCache size
- OOB Sitecore has ~6K items in
masterdatabase - ~25.4K items live in OOB
coredatabase - Each user has own access entries
- OOB Sitecore has ~6K items in
- Adding an element into cache with index costs 15 times more
Conclusions
AccessResultCache is aimed to avoid repeatable CPU-intensive operations. Unfortunately, default cache size is too small so that limited number of entries can be stored at once (even less than items in master & web OOB databases). The insufficient cache size flags even on development machine:

However, defining production-ready size leads to ~15540 times higher performance penalties during cache scavenge for OOB configuration = potential for a random lag.
A single configuration change (enable cache key indexing) changes the situation drastically & brings up a few rhetorical questions:
- Is there any reason for AccessResultCache to be scavenged even if security field was not modified? To me – no.
- Any use-case to disable cache indexing in production system with large cache?
- What is the purpose of the switch that slows system 15.5K times?
- Should a system pick different strategy based on predefined size & server role?
Summary
- Stock
Caching.AccessResultCacheSizevalue is too little for production, increase it at least 5 times (so that scavenge messages no longer seen in logs) - Enable
Caching.CacheKeyIndexingEnabled.AccessResultCacheto avoid useless performance penalties during scavenge