Problem statement
The application experienced a gradual increase in memory usage over the years, becoming notably problematic when it reached 20 GB of RAM.
Although memory snapshots revealed that more than 90 million custom objects were in memory, developers asserted all these objects were being utilized, owing to intricate business rules and calculations within the domain.
Introduction
Even if the development team is willing to re-architect the solution, a complete rebuild would take at least a year. Meanwhile, the business is currently grappling with performance issues.
In other words, if the situation continues, there may not be a business left to rebuild the solution for. The objects used by the application appear to be standard models, consisting of strings, numbers, and enums; the development team hasn’t engaged in any practices that would be considered “illegal” in software development terms.
Data distribution
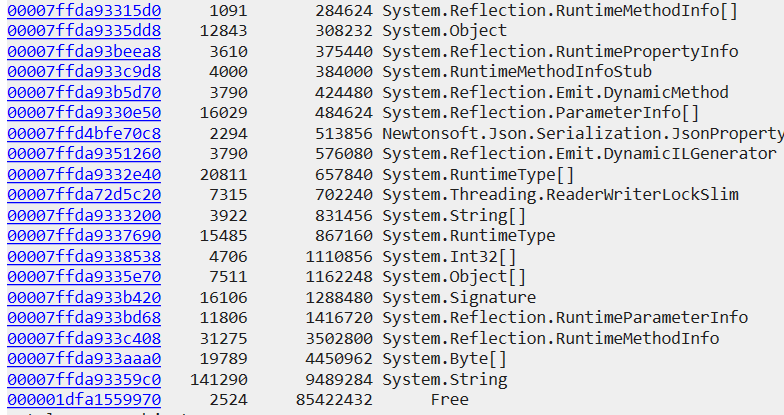
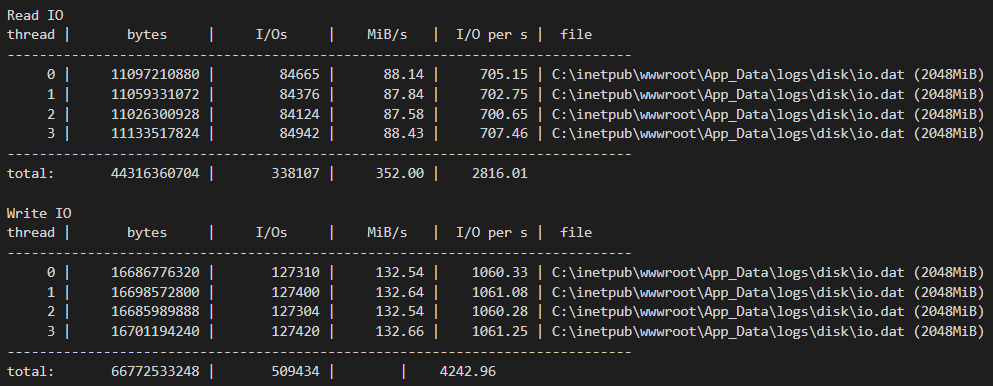
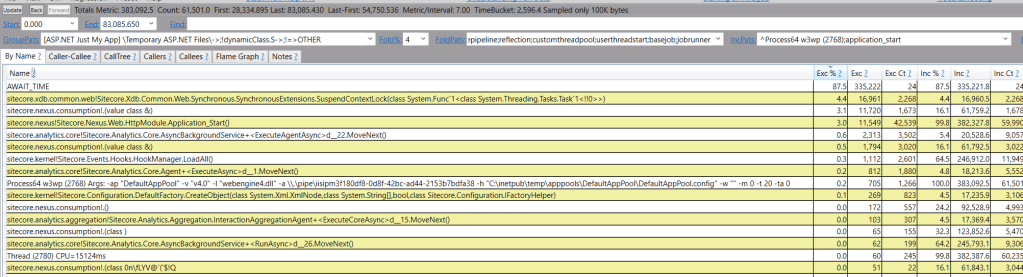
A few things are notable around largest RAM consumers:

Free ranges suggest that large objects are being instantiated, likely due to data arriving in massive batches.
While forcing garbage collection (GC) to compact the Large Object Heap (LOH) can reclaim space, this approach treats the symptom rather than the underlying cause, constituting a performance anti-pattern.
Despite this, we’ve managed to reduce LOH fragmentation and reclaim approximately 4 GB of RAM, good start.
Why so many strings?
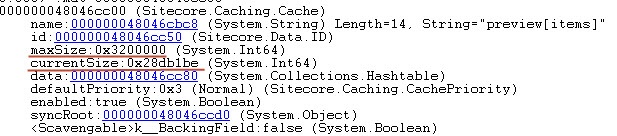
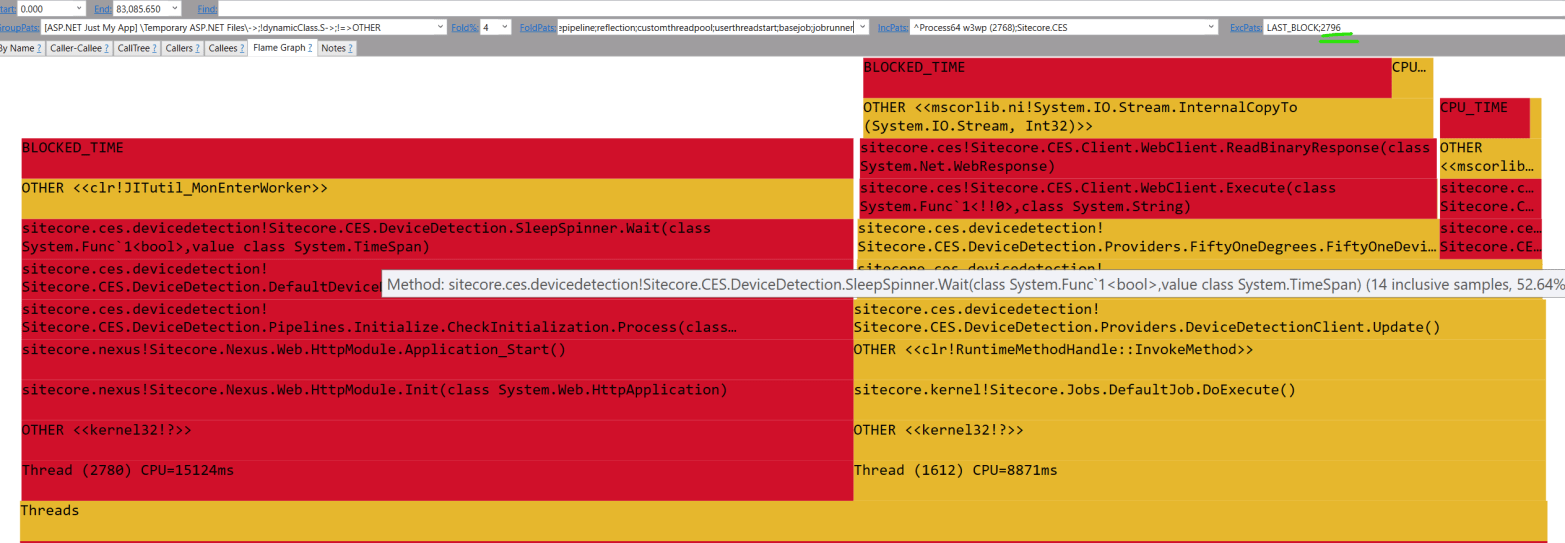
There are nearly one million instances of “true” or “false” strings in memory, they are not getting wiped by GC:

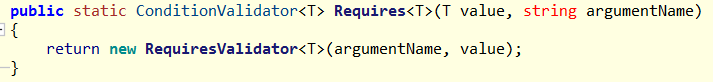
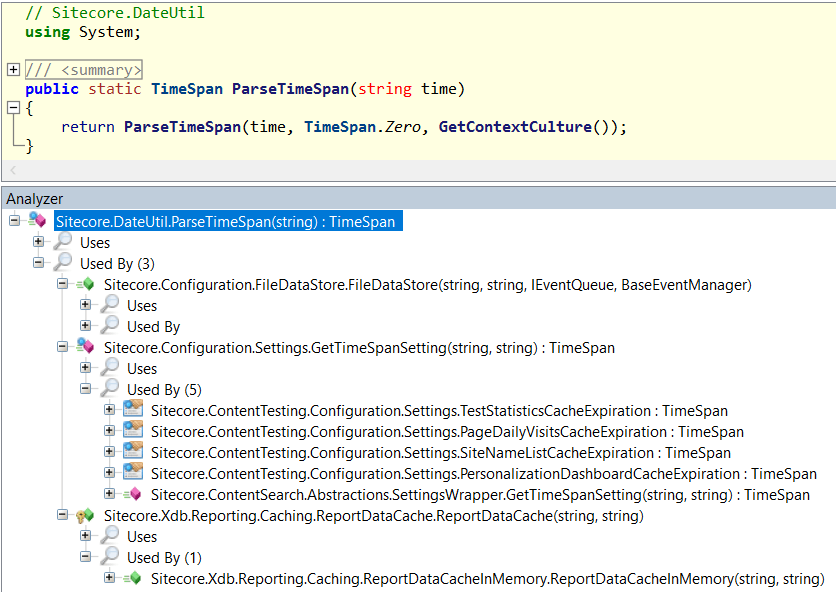
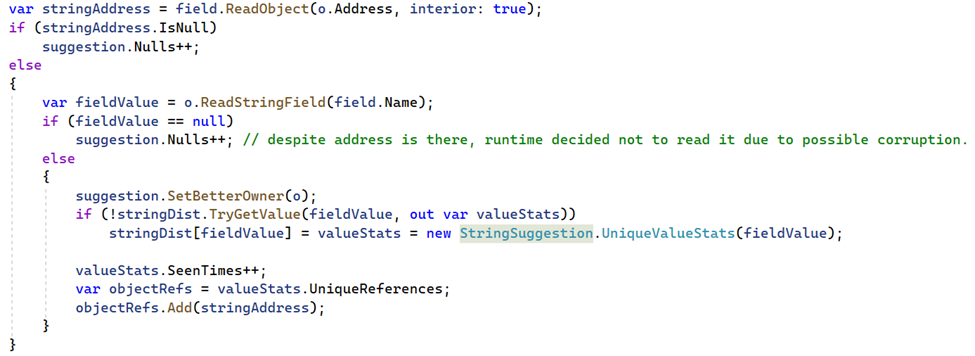
The presence of ‘rooted’ objects that are being used, yet each holds its own copy of the same string. We identified these strings’ owners as application models and modified their setters to use string interning. We opted for a custom interning solution over the built-in .NET mechanism for specific reasons. Upon further investigation, a similar pattern in a number of other models was discovered.
Although data is appropriately stored in a relational database, the materialized view used to populate the models joins the definition table with the actual table, abstracting the storage details from the application. The data reader instantiates a new string each time a row is materialized.
Will it be beneficial?
On one hand, string interning will be effective for model fields with repeatable values. On the other hand, models that contain unique strings could potentially lead to memory leaks.
Given that the memory snapshot contains all the data the application operates on, we can identify fields with a high or low number of unique values. This allows us to implement string interning selectively, based on empirical data:
Despite having over 633,000 class instances in memory, there are 12.5 times fewer unique values (50K):

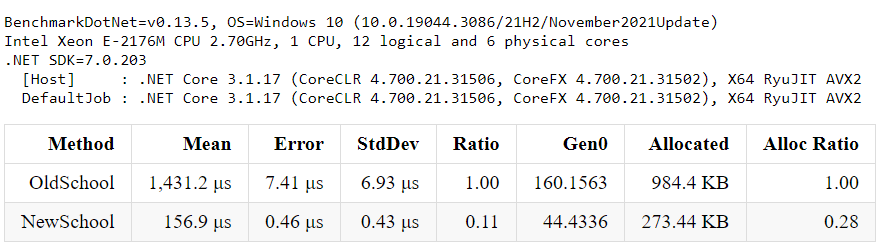
By enabling string interning for that specific field alone, the expected memory consumption is reduced by a factor of 12. The savings are even greater as we’ve chosen to skip rare/big values.
Considering over a dozen of places located, a significant memory pressure relief has already been achieved, but is there further room for optimization?
Spoiler alert – yes, since object count is huge, few bytes saved on each object translate into massive overall win. Stay tuned for the second part.