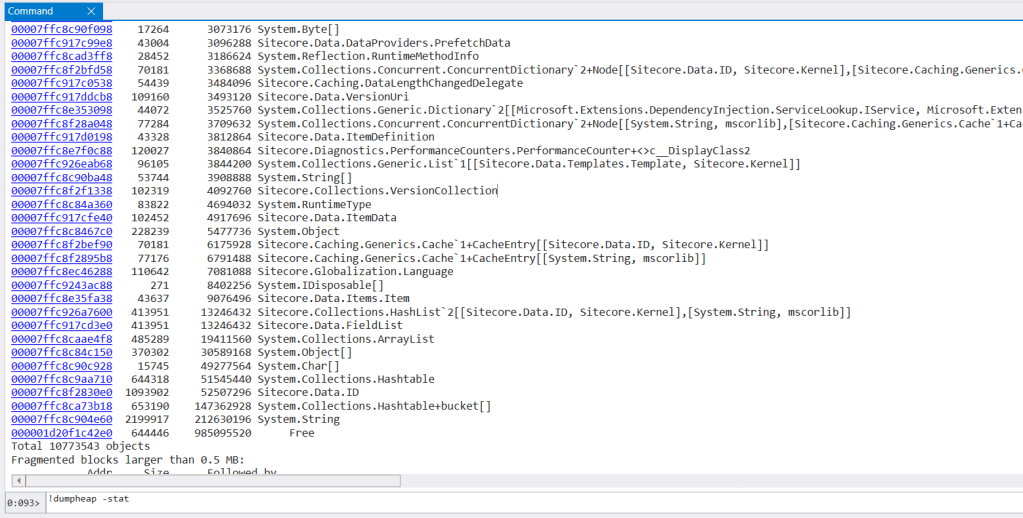
!dumpheap -stat reports which objects live in heap:
First column is a type descriptor (method table) aka type unique identifier.
The second column shows how many objects of that type are in heap.
The third column shows own object size (without following nested references).
Use case: Comparing live stats between memory snapshots collected within a few minutes interval would flag growing types, and potential cause of a memory leak.
-name include only types that contain string in name
-live (slow) leaves only objects that are alive
-dead shows only objects that are eligible for garbage collection
-short show only object addresses
-strings print strings only
-mt print objects only of given type by with method table ID
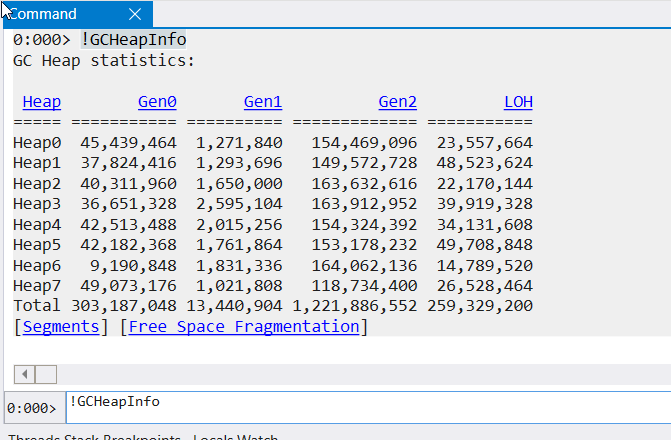
GC heap stats
!gcheapstat (or !gcheapinfo by MEX) the running size of each heap segment, as well as its fill ratio:
Heap statistics
Use case:
Large objects end in LOH that is not compacted by default. As a result, large objects can provoke additional memory allocations in case existing blocks are insufficient = look like a memory leak.
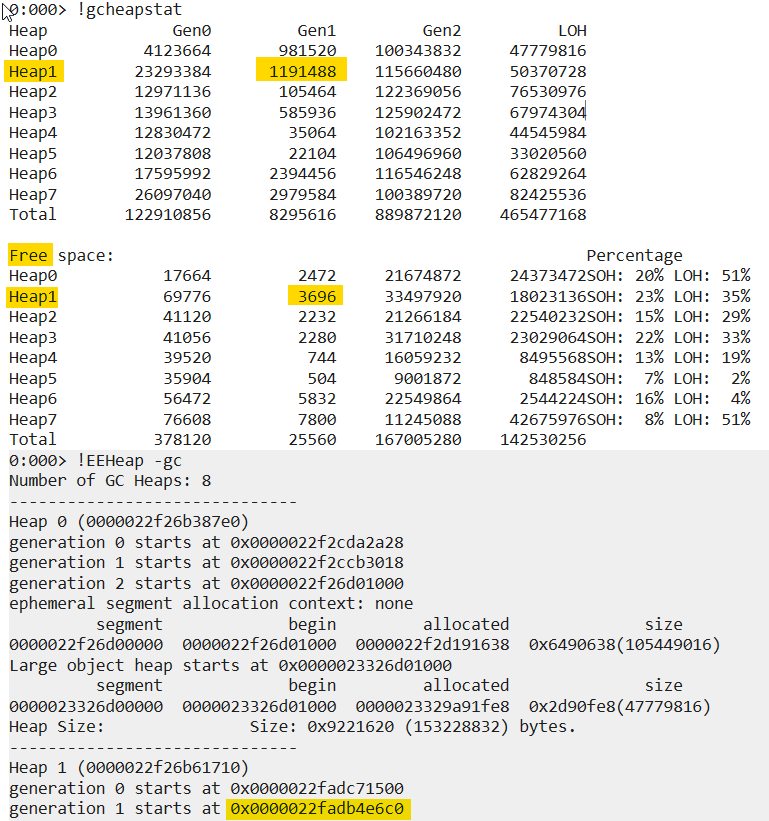
What are the dead objects in ‘older’ generations:
Dump dead objects from generation start till segment generation end(? 0x0000022fadb4e6c0+0n1191488) = 0000022fadc71500:
Sum heximal (0x) format with decimal (0n)
Performing same operation for GEN2 from heap 5:
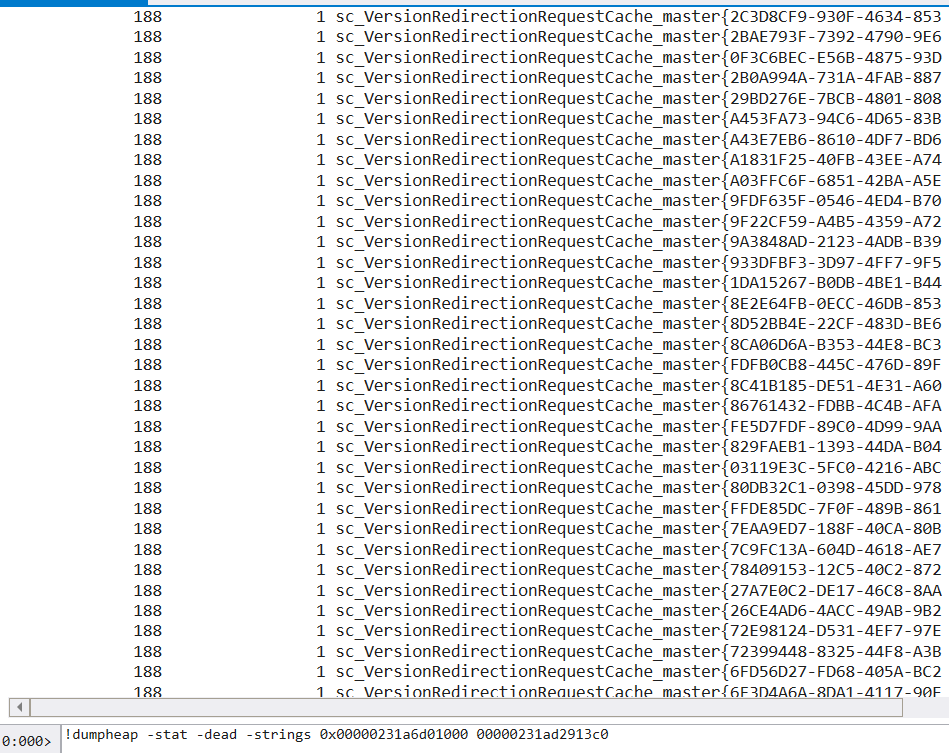
Strings are in top 3, getting the content of strings by adding -string option:
Huge Work queue flags operations are added faster than being processed
Notes
Command is overloaded by MEX, thereby unload extension prior to the call
CPU is system wide meaning other processes could steal the show
Ongoing operations performed by managed threads
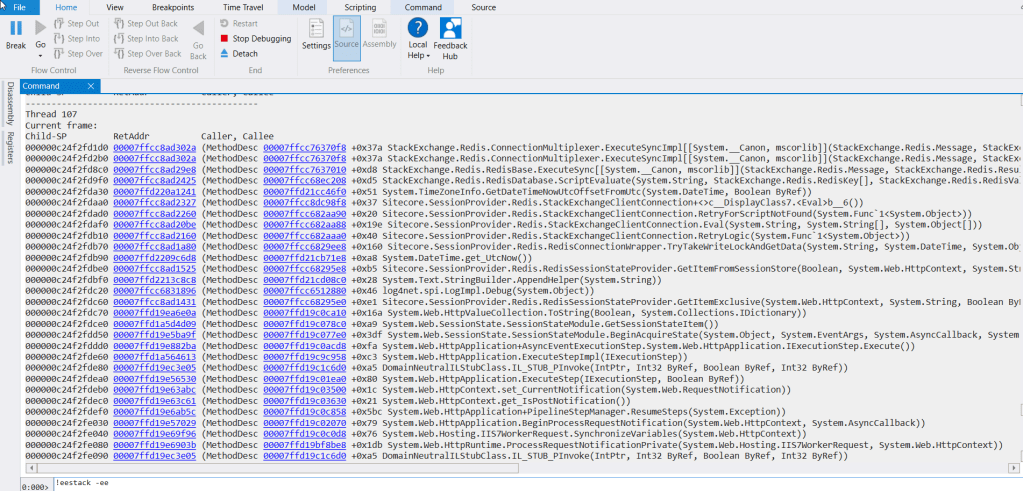
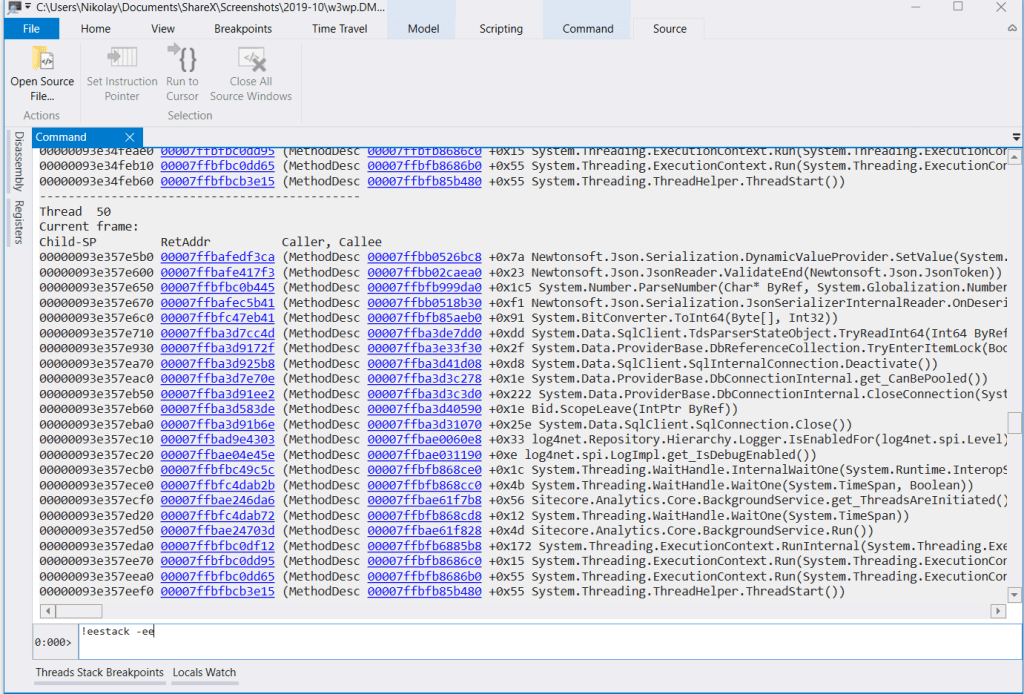
!eestack -ee by SOSEX prints each managed thread call stack:
Use case: Figure out what activities are performed in the snapshot.
Notes
FileWatcher/LayoutWatcher (threads dedicated to certain activity) wake up once in a while (like every half second) to do the status check, they are not usually interesting.
Sitecore.Threading.ManagedThreadPool threads are persisted during application lifetime so that visible in output. Should no operations be added for processing, threads would be idle-ing, hence not consuming any CPU.
How much CPU did each thread consume?
!runaway shows how much CPU time did each thread consume since app start:
Use case: Comparing the numbers between two sequential snapshots would highlight top CPU-consuming threads in between. Stats from single snapshot rarely makes any use since data is aggregated per-thread since application start.
Non-managed stack traces
~* kb 20 outputs top N frames from every thread in application:
Use case: Figuring out what unmanaged operations are running (GC/finalization, attempts to enter critical sections).
Notes: 81% CPU usage is a magic number that likely indicates garbage collection is running, top frame would show phase (f.e. mark/compact). The MSDN article mentions dedicated threads for GC – you can see them on your own (the ones with gc_heap) in unmanaged call stacks.
~[ThreadNumber]s would set [ThreadNumber] as context one, picture sets last ThreadPool worker thread as context one.
Use cases: inspect objects that live on thread stack, map them to executed frames.
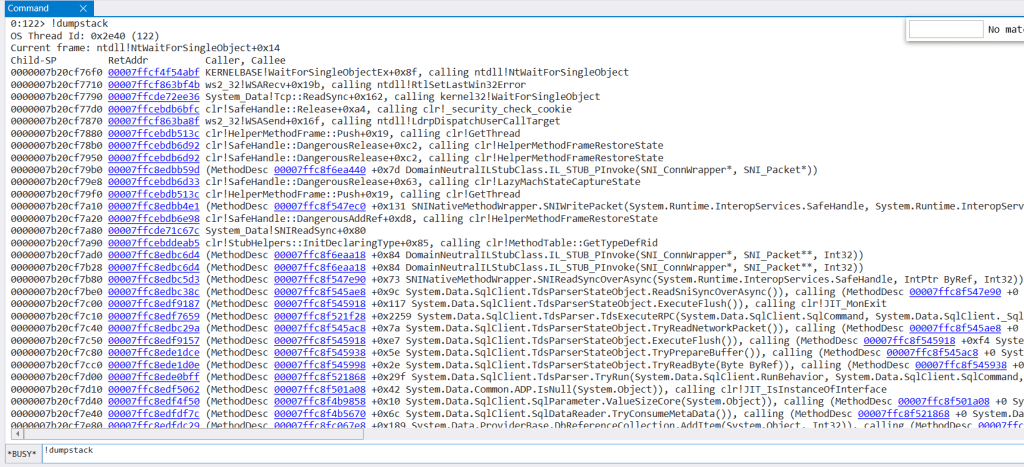
Dump stack objects
!mdso by SOSEX prints objects that live in thread stack:
Use case: Get the data thread operates with (method args would live here).
Restoring thread call stack
Call stacks could make no sense from first sight as CLR can optimize code execution. !dumpstack & clrstack use different semantics to restore call stacks:
Sitecore Content Testing finds most effective content variations. It is aimed to improve user experience via testing various content variations and picking top influencing ones.
How content optimization are decisions made?
Decisions are made by aggregating live site visitors behavior for each variant.
How does it know what content to test?
Sitecore_suggested_test_index has computed values for all of the eligible items in the content tree to be optimized.
What is the performance price to pay?
Index should be rebuilt periodically (daily) for fresh data
Aggregation extracts extra bits from tracked data
Item-level API always checks if item under test (a few versions of same content may exist simultaneously)
Room for improvement in every step
Suggested Test index
Content Testing index attempts to index everything under the /sitecore/content
...
            <locations hint="list:AddCrawler">
              <crawler type="Sitecore.ContentTesting.ContentSearch.SpecificSitecoreItemCrawler, Sitecore.ContentTesting">
                <Database>master</Database>
                <!-- Limit this parameter to the root of the content of the site. -->
                <Root>/sitecore/content</Root>
              </crawler>
            </locations>
Default config has a comment to narrow crawler root to actual stored content.
The ‘exclude‘ node allows some items to not be added into the index:
By default, everything would be indexed by Sitecore (except 2 templates).
Knowing which items are actually content ones (thereby are eligible for testing) enables us to exclude others, hence let system operate with less data.
Item by template content statistics
The query locates all items under site node and groups them by template id:
WITH ContentItems AS (
  SELECT
    DISTINCT(ID)
  FROM Items
  WHERE
    ParentID = '{0DE95AE4-41AB-4D01-9EB0-67441B7C2450}' -- Content item ID, change to relevant one
  UNION ALL
  SELECT
    m.ID
  FROM Items m
  JOIN ContentItems q ON m.parentID = q.ID),

PopularItemTemplates(TemplateID, Hits) AS (
  SELECT
    [TemplateID],
    Count(1)
  FROM Items i
  JOIN ContentItems u ON u.ID = i.ID
  GROUP BY
    TemplateID
  HAVING
    Count(1) > 300)

SELECT
  t.TemplateID,
  i.[Name] AS [TemplateName],
  t.[Hits] AS 'Based on template'
FROM PopularItemTemplates t
JOIN Items i ON t.TemplateID = i.ID
ORDER BY
  t.Hits DESC
A list of most popular templates under content root is given for a review.
Indexing results
3 times less documents getting stored in index (24K vs 8K) in our success story.
Additionally, you might want to follow Azure query advisor recommendations as it analyzes your database workload and provides suggestions specifically for that load.
Simple – there will be people I admire. Their ideas had a tremendous influence and cultivated a specialist from me.
Tribute to Michael Feathers
Any improvements into Sitecore was a ‘fix here breaks there‘ roulette due to a lack of safety net harness.
Working Effectively with Legacy Code had all the solutions (practices) to follow. The book shows how to improve tangled code base. I’m proud to say Kernel safety net was developed thanks to Michael.
There are at least three books each developer is recommended to read:
The Art of Unit Testing is one of the superlative books explaining TDD and the importance of having self-checking code. I have not met a single person who after reading the book would not write tests.
This post shows WinDBG commands to analyse SQL queries produced by application. Answering the mystery what parts of program bombard SQL Server with queries.
Ongoing SQL commands
MEX!sqlcmd finds all SQL commands & their state & executing thread:
All SQL commands found in snapshot
Use case: Figuring out the nature of load produced on SQL Server. An owner thread call stack would show where the query is coming from.
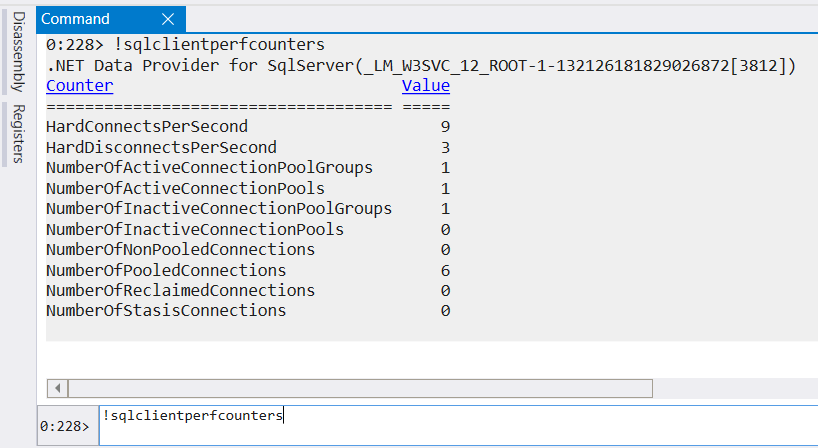
SQL connectivity stats
MEX!sqlclientperfcounters displays the connection stats:
Use case: Number of pooled connections could be treated as max SQL commands executed concurrently. That is useful to understand if snapshot collected during peak pressure.
SQL Commands per database
!sqlcn groups commands per connection string:
Use case: Shows most-queried (connection strings)/databases application-wide.
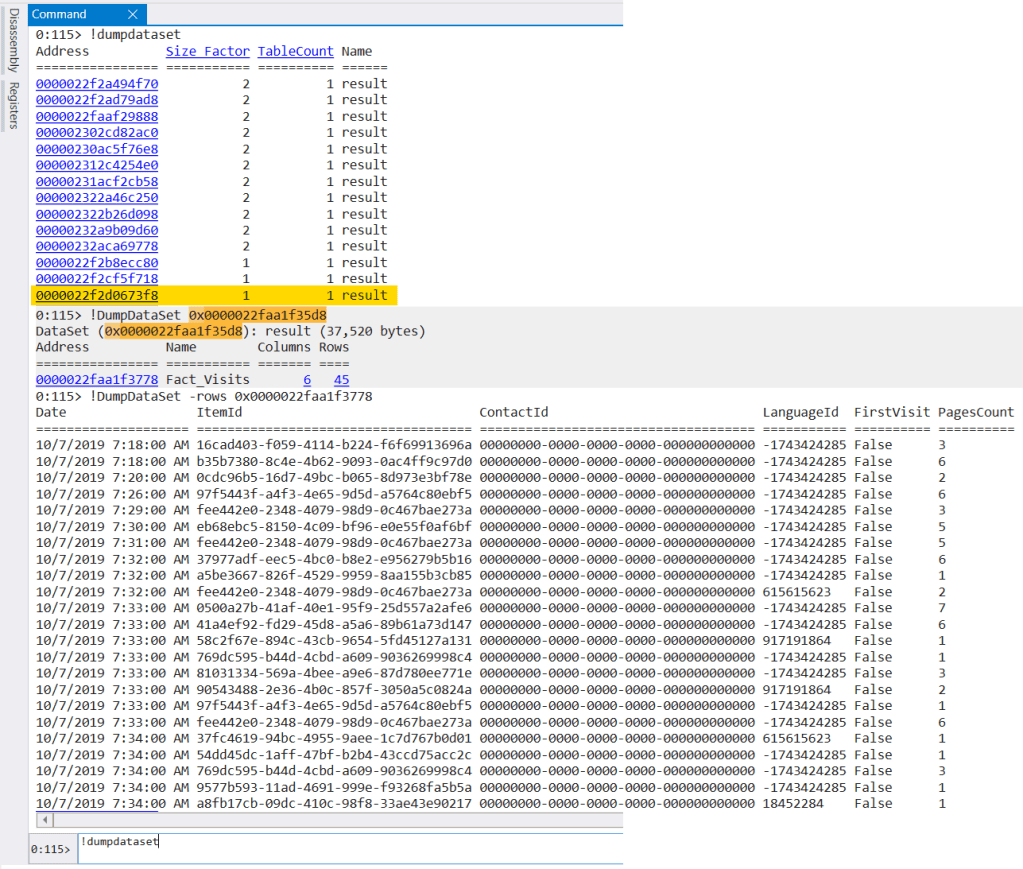
Find all DataSets
!dumpdataset finds DataSet instances in memory with a possibility to view content:
Data set content
Use case: Find the data that mimics database content (either a caching layer, or collected data pending to be pushed). Sitecore Processing uses DataSets to populate reporting (one interesting investigation is coming).
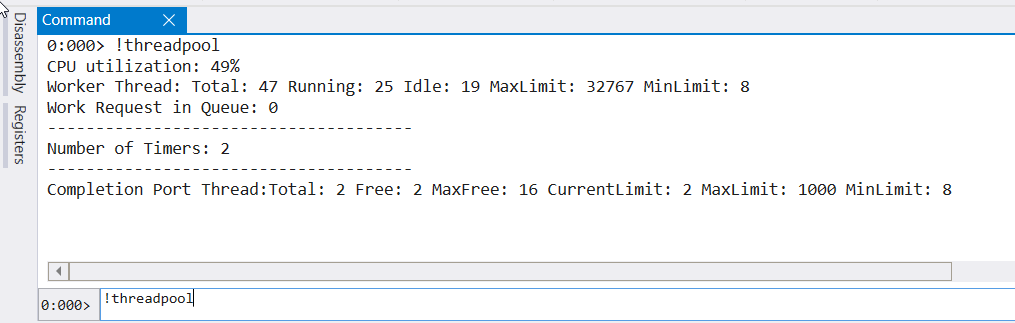
!theadpool command shows avg. CPU usage (during last second), number of active threads, and callbacks:
Threadpool
Use case: High CPU investigations, ensure snapshot was collected during maxed CPU. Shows pending callbacks (if any) as well as how many threads are there.
What threads are consuming CPU time?
!runaway shows aggregated CPU time taken by each alive thread:
Use case: A difference between a few sequential snapshots shows threads using CPU resource in between. Useful during high CPU investigations.
What does each thread do?
Each thread either performs some operation, or waits to do something.
!eestack -ee prints managed call stacks for all the threads:
Each thread call stack
Use case: Get an overview of ongoing activities, always useful:
Are threads waiting for exclusive access? F.e. lock (obj)
Are ASP.NET requests being processed? Trail – IIS7WorkerRequest class
What are the operations performed by most CPU consuming threads?
Similar/repeatable patterns?
What does each thread do (shorten version)
Mex extension powers !mthreads showing top frame/action performed by thread:
High-level overview of ongoing activities
Use case: High-level overview of ongoing operations in the snapshot
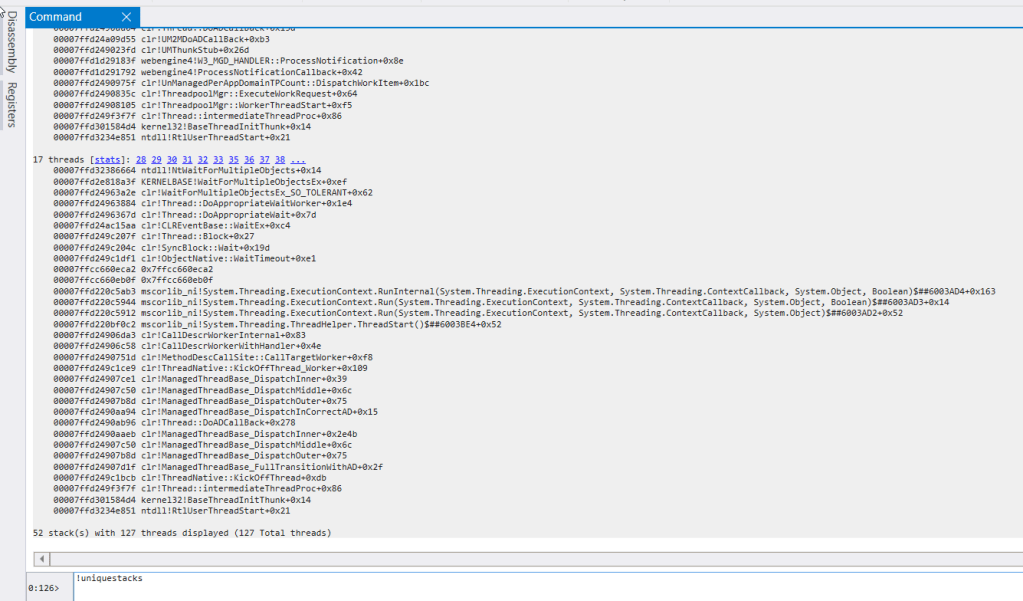
Group threads by call stacks
MEX!uniquestacks groups threads by operations they execute:
Threads grouped by call stacks
Use case: Locate repeatable patterns in one go.
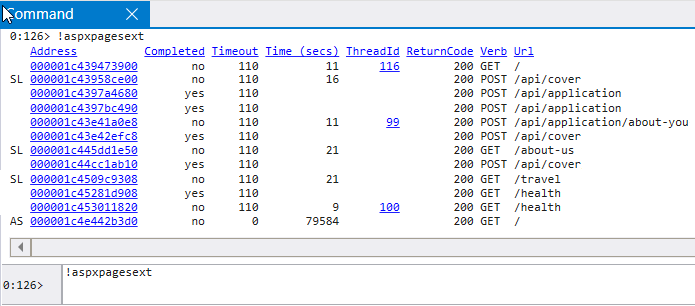
Find currently executed ASP.NET requests
MEX!aspxpagesext gives stats for processed ASP.NET requests:
ASP.NET requests executed
Use case: Get the number of concurrent requests & how long they run for.
Determine construction mechanisms for these instances
Collecting memory snapshots
A few memory snapshots have been collected via Task Manager:
Collecting memory snapshot via Task Manager
Snapshot can be collected automatically once memory is higher than threshold.
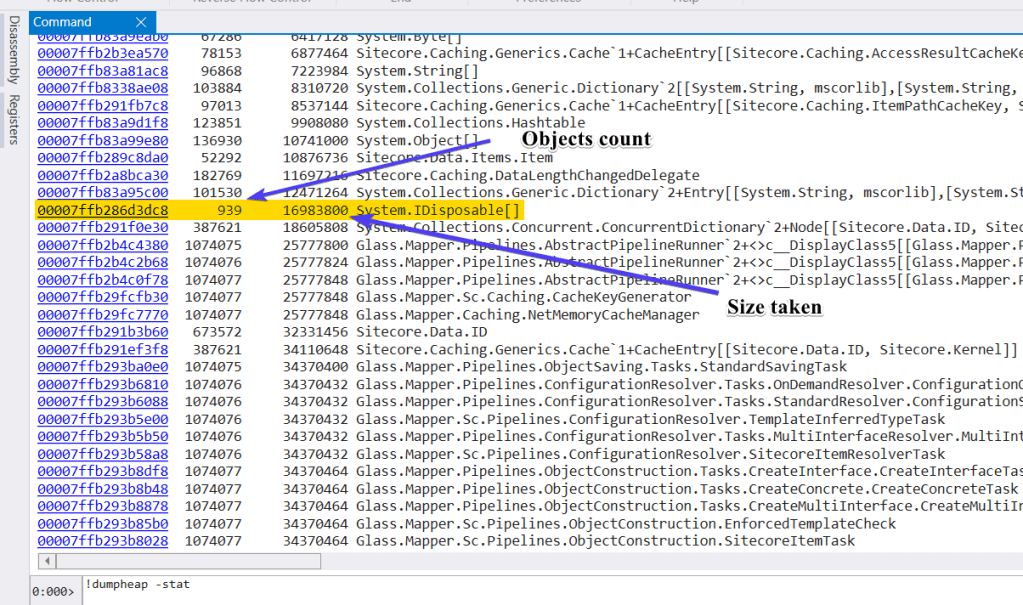
Any anomalies in heap statistics?
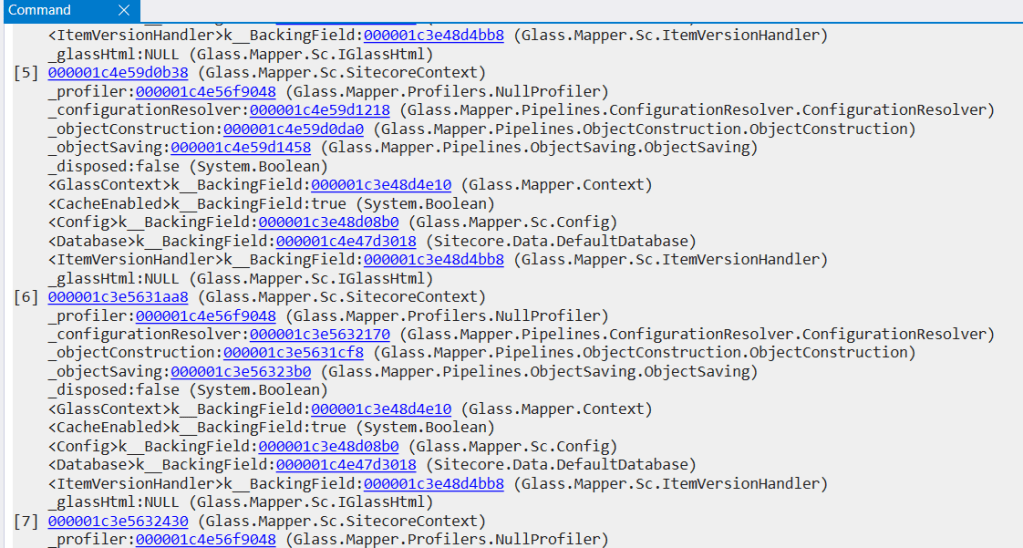
Both snapshots contain a huge number of GlassMapper objects that contradicts the module usage pattern (create many short-lived objects):
Heap statistics in both snapshots
We could either find !gcroots (who holds object in memory) for suspicious classes that have much higher count than expected or look for unexpectedly huge objects in the heap.
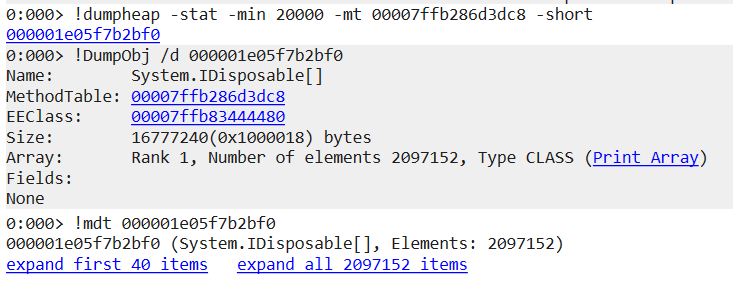
A few IDisposable[] arrays take as much space as 100K objects?! That is over 2200 elements in average (or ~18KB) inside array. There are over 700 huge arrays each having over two thousands disposable elements each, sounds as a code smell.
Finding bigger than average arrays with size over 20K bytes (via min param):
Huge array with over 2 million entriesGlass mapper objects stored inside
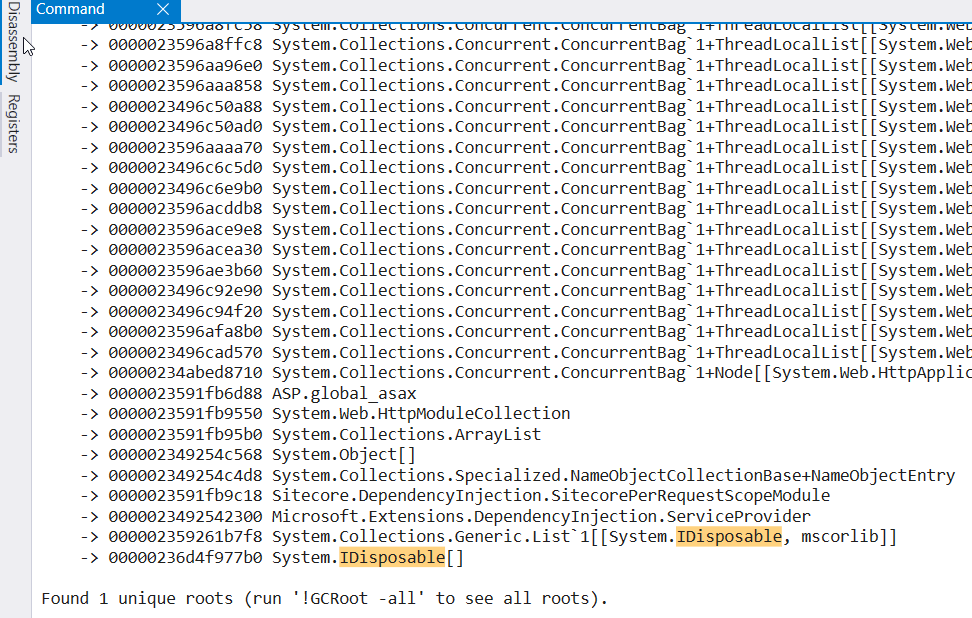
Two million elements long array (disposable GlassMapper objects inside) is rooted to ServiceProvider:
SitecorePerRequestScope module roots array in all snapshots
Same pattern is met in all the captured snapshots.
Hypothesis
GlassMapper disposable objects are resolved from global DI scope, hence getting disposed when application shuts down. Objects are stacked in memory until then.
Alternatively disposed scope is used to keep on resolving objects.
Who creates objects that are never disposed?
Although leaking classes can be modified to save birth call stack & ServiceProvider used to create them, not owned types cannot be modified to add that code.
Nevertheless, behavior could be simulated on a test disposable class and Sitecore DI mechanism.
Prediction
At least one way for creating disposable objects produces leak by rooting to either global DI scope (list of resolved IDisposable dependencies), or re-using disposed scope.
Attach to process with WinDBG and inspect alive instances
How where they created
Who roots them in memory
Demo code
The disposable dependency records its birth call stack and capture the ‘parent’ service provider:
using System;
using System.Threading;
using Sitecore.Abstractions;
using Sitecore.Diagnostics;
using Sitecore.Pipelines;

namespace Demo
{
    /// <summary>
    /// Registered in DI with transient scope.
    /// <para>Dispose is to be called upon scope end.</para>
    /// </summary>
    public class DisposableDependency : IDisposable
    {
        private readonly BaseLog _log;
        private readonly IServiceProvider _parent;
        private static int _instancesCount;
        private readonly string _birthCertificate;

        public int Number { get; }

        public DisposableDependency(BaseLog log, IServiceProvider parent)
        {
            Assert.ArgumentNotNull(log, nameof(log));
            _log = log;
            _parent = parent;
            Number = Interlocked.Increment(ref _instancesCount);
            _log.Warn($"Dummy processor was born: {Number} {Environment.NewLine} {Environment.StackTrace}", this);
            _birthCertificate = Environment.StackTrace;
        }

        public void Process(PipelineArgs args)
        {
            _log.Warn($"Dummy processor was executed: {Number} {Environment.NewLine} {Environment.StackTrace}", this);
        }

        void IDisposable.Dispose() => _log.Warn($"Dummy processor died: {Number} {Environment.NewLine} {Environment.StackTrace}", this);
    }
}
Injection to types created by Factory
Sitecore creates objects via DI if resolve=’true’ attribute set in config node.
New instance is created each time if reusable=’false’ attribute is set for processor:
<?xml version="1.0"?>

<configuration xmlns:patch="http://www.sitecore.net/xmlconfig/" xmlns:set="http://www.sitecore.net/xmlconfig/set/">
    <sitecore>
        <services>
            <!-- Register disposable service -->
            <register serviceType="Demo.DisposableDependency, Demo" implementationType="Demo.DisposableDependency, Demo" />
        </services>

        <pipelines>
            <initialize>
            <!-- Register controller route to test MVC constructor injection -->
                <processor type="Demo.RegisterRoute, Demo"/>
            </initialize>

            <disposableSample>
            <!-- Register processor to be created every time -->
                <processor type="Demo.DisposableDependency, Demo" resolve="true" reusable="false" />
            </disposableSample>
        </pipelines>
    </sitecore>
</configuration>
Define the disposableSample pipeline with non-reusable DisposableDependency so that a new instance is created for each call. Invoke it via dummy page:
using System;
using System.Web;
using Sitecore.DependencyInjection;
using Sitecore.Diagnostics;

namespace Demo
{
    [AllowDependencyInjection]
    public partial class ConstructorInjection : System.Web.UI.Page
    {
        private readonly DisposableDependency _dependency;

        protected ConstructorInjection()
        {
        }

        public ConstructorInjection(DisposableDependency dependency)
        {
            Assert.ArgumentNotNull(dependency, nameof(dependency));
            _dependency = dependency;
        }

        protected void Page_Load(object sender, EventArgs e)
        {
            HttpContext.Current.Response.Write($"<h2>I was called {_dependency.Number} </h2>");
        }
    }
}
Injection and MVC
Controller that needs disposable dependency:
using System.Web.Mvc;
using Demo;
using Kerzner.Foundation.DependencyInjection;

namespace Kerzner.Project.BrandWebsites.Pipelines.ScScopeVerification
{
    [Controller]
    public class DummyController : Controller
    {
        private readonly DisposableDependency _dependency;

        public DummyController(DisposableDependency dependency)
        {
            _dependency = dependency;
        }

        public ActionResult Index()
        {
            return Content($"<h2>called {_dependency.Number} <h2/>");
        }
    }
}
Controller registration:
using System.Web.Mvc;
using System.Web.Routing;
using Sitecore.Pipelines;

namespace Demo
{
    public class RegisterRoute
    {
        public void Process(PipelineArgs args)
        {
            RouteTable.Routes.MapRoute(
                "DisposableDependency",
                "DummyController",
                new { controller = "Dummy", action = "Index" });
        }
    }
}
Test results
Non-disposed dependencies are created by Factory
Sitecore DefaultFactory (registered as singleton) captures scoped ServiceProvider. Any object is created from that service provider reuses that scope instead of one valid for request. Birth certificates proof objects created by Factory thereby leaking memory.
ASP.NET pages do not dispose some dependencies as well
AutowiredPageHandlerFactory creates ASPX pages with the respect to proper scope from the first sight. Nevertheless, it does not work as intended due to handler factory cache inside HttpApplication.
Even though correct service provider scope is used at first, it would still be re-used for further requests processed by the instance of HttpApplication.
Conclusion
The memory leak mystery was resolved thanks to a few memory snapshots. Once the cause is found, code adjustments could be done:
Do not resolve disposable objects from DI, prefer explicit creation (in case possible) to favor explicit dispose call
Consume per-request scope from Sitecore.DependencyInjection.SitecorePerRequestScopeModule.GetScope to resolve dependencies from request-bound scope so that disposed is called on EndRequest
Sitecore framework improvement to keep in mind potential nature of disposable dependencies
The behavior described in the article has been reported to Sitecore Support and accepted as 331542 bug report.
WinDBG debugger brings you behind the scenes to witness CLR magic from backstage. You’ll be able to see the hidden gems that turn magic into reality.
This post shows basic WinDBG commands to begin your journey. It is a good one to start exploring the world full of fascinating technical magic.
Snapshot creation time
Similar to picture capturing a single point in time, memory snapshots captures the process state in single moment.
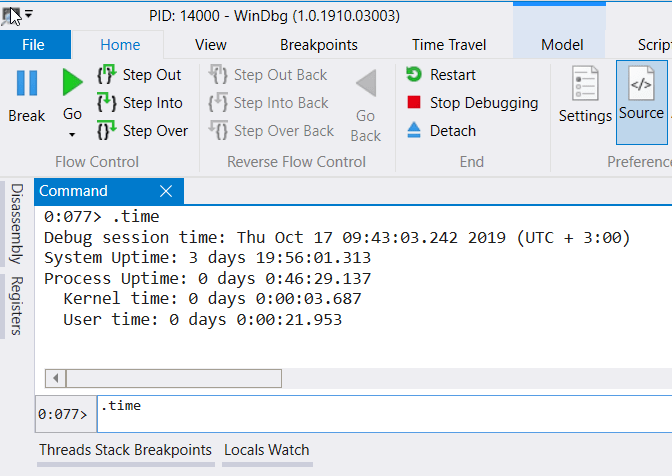
.time command shows when the snapshot was taken or time of the debugging session (in case attaching to process)
.time command example
Use case: Get the time diff between a few sequential memory snapshots.
The distance between SPECS cameras is known as well as speed limit. Hence the minimal legal journey time is known.Speeding fine shall be issued in case two cameras capture same car in shorter span.
Load extension
.load [path] command loads WinDBG extension into debugger
WinDDB extension load example
Anybody can create extension to automatize the sequence of re-occurring steps.
Use case: Extensions provide additional commands to execute, or better view for same data (like displaying object content !do vs !mdt).
List of loaded extensions into WinDBG
.chain command shows extensions currently loaded into debugger
Display WinDBG loaded extensions
Use case: Verify extensions powering commands are loaded (f.e. mex).
Unload extension
.unload [path] command unloads extension from debugger
Unloading extension from WinDBG on demand
Use case: Commands might overlap (sos and mex define !threadpool).
Memory snapshot captures a picture of the process in time. It is a source of wonderful information about application. You can see on your own what operations are being executed, is there a bottleneck around locking expensive resource and so much more. The most important part to me is to see the application from the angle you’ve never seen it before.
The debugger must load data access component (DAC) (mscordacwks.dll) from the machine snapshot was created on.
Although in 99% of the cases debugger is able to load needed version from the web, you might need to copy it from ‘%WINDOWS%\Microsoft.NET\Framework64\[framework_version]\mscordacwks.dll‘ location.
WHAT IS ‘SOS’ ?
SOS Debugging Extension (SOS.dll) provides information about the internal Common Language Runtime (CLR) environment. In simple words – it translates data to human-understandable format
Automatically load needed assemblies
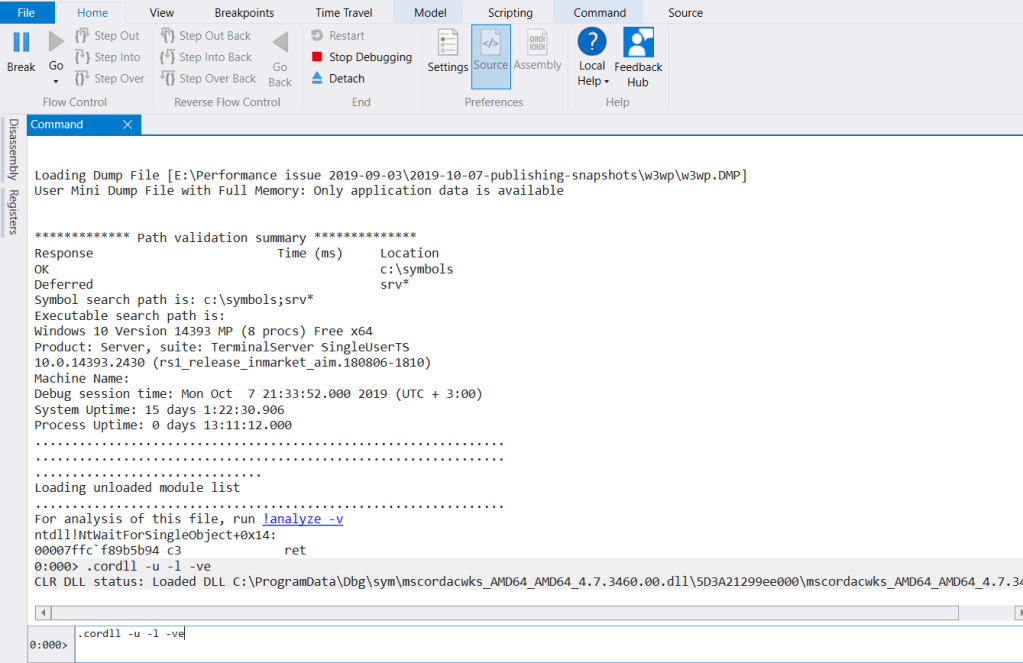
The .cordll -u -l -ve command attempts to automatically load core dll:
Core DLL for snapshot processing is loaded
Manually load needed assemblies
Should command fail to locate matching version, you’ll need to get the assembly from source machine and manually load it with .load:
Manually loaded mscordacwks.dll
Open local memory snapshot
Should the memory snapshot be collected from local machine, local core dll can be loaded via .loadby sos clr command:
Verify snapshot is loaded correctly
Execute any sos-driven command (f.e. !eestack -ee ) to verify snapshot loaded correctly:
It is a snapshot of an application, similar to real-world picture – just an array of bytes:
Application picture
Real world picture
Application snapshot VS real world picture
How to open memory snapshot?
As you need software to open pictures you need WinDBG to open memory snapshots.
What is inside the snapshot?
Typical park picture
Trees, humans, birds
The timestamp it was taken
Clues about ongoing activities
Tree top bend hints wind
Sport outfit hints jogging
A queue to the coffee shop
Some fallen branches
Application picture
All objects
The timestamp it was collected
Thread call stacks
SQL – hints DB activity
IIS7Request – hints ASP.NET
How many entries in queue
No longer needed data
What cannot be answered from one snapshot?
Typical park picture
When the tree was planted?
What is the speed of the wind?
For how long the guy is running?
How fast the shop queue is being processed?
When did the branch fall?
Application picture
When was an object created?
How fast operation is executed?
For how long the request is processed?
Is the processing queue grows or shrinks?
When was the object last used?
MYTH: WHY SLOW FROM SINGLE SNAPSHOT
At least sequential 2 pictures depicting same activity are needed. The progress (f.e. number of records processed/(queue length)) is checked in both snapshots and correlated to time stamp difference.
CONFIRMED: CACHE STATS
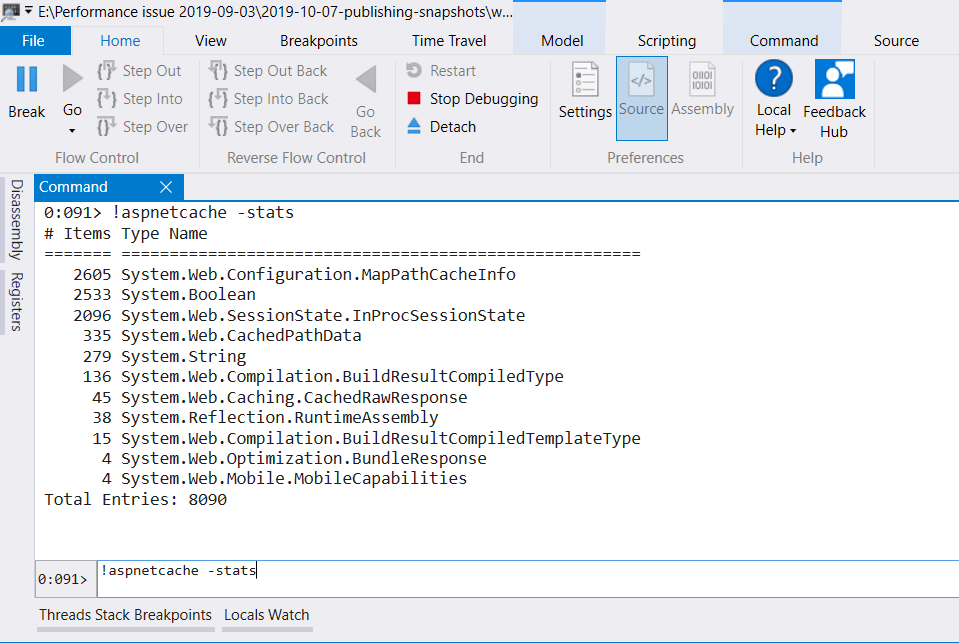
Caching layer is typically implemented based on objects, that are captured in single snapshot.
ASP.NET cache summary
CONFIRMED: ONGOING SQL COMMANDS
SQL commands are implemented as objects, hence visible in a single snapshot.
SQL commands captured in the snapshot
CONFIRMED: ANYBODY CAN OPEN SNAPSHOT
All you need is proper program to open it. Assistant file (translator) might be needed from exact machine in case not found in web automatically.